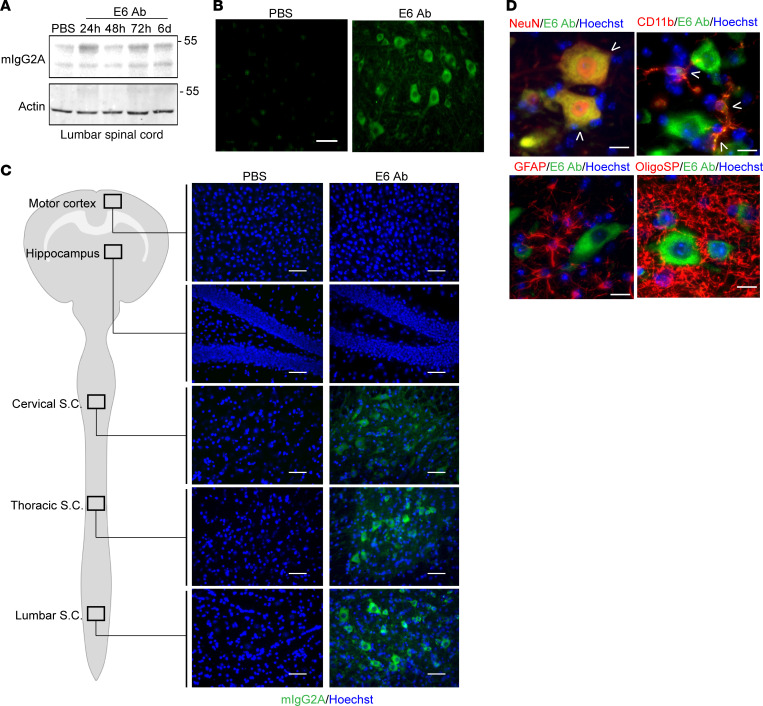
Figure 7. Tissue and cellular distribution after intrathecal delivery.
(A) Western blot for mIgG2A in total lysate from lumbar spinal cord of mice injected intrathecally with E6 or equal volume of PBS. Actin was used as loading control. (B) E6 Ab distribution in coronal sections of lumbar spinal cord. Tissues were analyzed from mice after 24 hours from PBS treatment and 48 hours after E6 Ab treatment. Signal represents mIgG2A (green). Scale bar: 50 μm. (C) Representative images of the E6 antibody (mIgG2A staining, green; merged with Hoechst, blue) distribution in the lumbar, thoracic, and cervical regions of the spinal cord (S.C.) and brain (hippocampus and motor cortex) after 5 weeks of repeated intrathecal injections. Scale bar: 50 μm. The analyzed areas are highlighted in the schematic representation of the CNS. Representative pictures for control antibody are shown in Supplemental Figure 7C. (D) Representative channels merged images of immunofluorescence for E6 antibody (mIgG2A staining, green); markers for neurons (NeuN, red), microglial cells (CD11b, red), astrocytes (GFAP, red), and oligodendrocytes (OligoSP, red); and nuclei (Hoechst, blue) in ventral horns of lumbar spinal cord after 5 weeks of repeated injections. Arrowheads show colocalization. Scale bar: 20μm. Single channels pictures are shown in Supplemental Figure 7D. Results in B, C, and D were performed in 3 mice per conditions and confirmed in multiple sections from the areas of interest. The control antibody used was clone 807.33.

