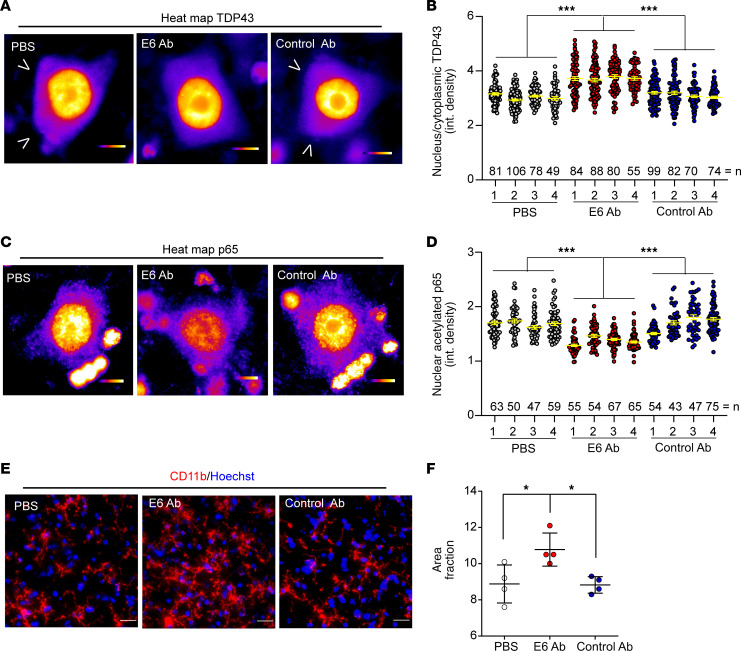
Figure 8. Treatment with E6 antibody reduces cytoplasmic TDP43 and nuclear p65 in lumbar motor neurons.
(A) Representative high-magnification colorimetric heatmap images of TDP43 immunofluorescence. Single channels images are shown in Supplemental Figure 8C. Scale bar: 10 μm. Arrowheads show cytoplasmic TDP43. (B) Graph represents quantification of nuclear to cytoplasmic integrated density of TDP43 signal in single large neurons counted in ventral horns of mice lumbar spinal cord. Data are represented as mean ± SEM; number of counted neurons (dots) from 4 independent mice (numbered 1–4) is shown in the graph; 1-way ANOVA (F11,934 = 36.98, P < 0.0001), ***P < 0.0001 by Tukey’s multiple comparison test. (C) Representative high-magnification colorimetric heatmap images of p65 immunofluorescence. Single channels images are shown in Supplemental Figure 9A. Scale bar: 10 μm. (D) Graph represents quantification of nuclear integrated density of p65 signal in single neurons counted in anterior horn of the lumbar spinal cord. Data are represented as mean ± SEM; number of counted neurons (dots) from 4 independent mice (numbered 1–4) is shown in the graph; 1-way ANOVA (F11,667 = 36.39, P = 0.0011), ***P < 0.001 by Tukey’s multiple comparison test. (E) Representative images of immunofluorescence for microglial cells (CD11b, red) merged with nuclei (Hoechst, blue) performed on lumbar spinal cord of treated mice. Scale bar: 20 μm. (F) Graphs represent quantification of percentage of area covered by CD11b signal (area fraction). Data are represented as mean ± SEM; n = 4 independent mice, dots. One-way ANOVA (F2,9 = 6.906, P = 0.0151),*P < 0.05 by Tukey’s multiple comparison test. The control antibody used was clone 807.33.

