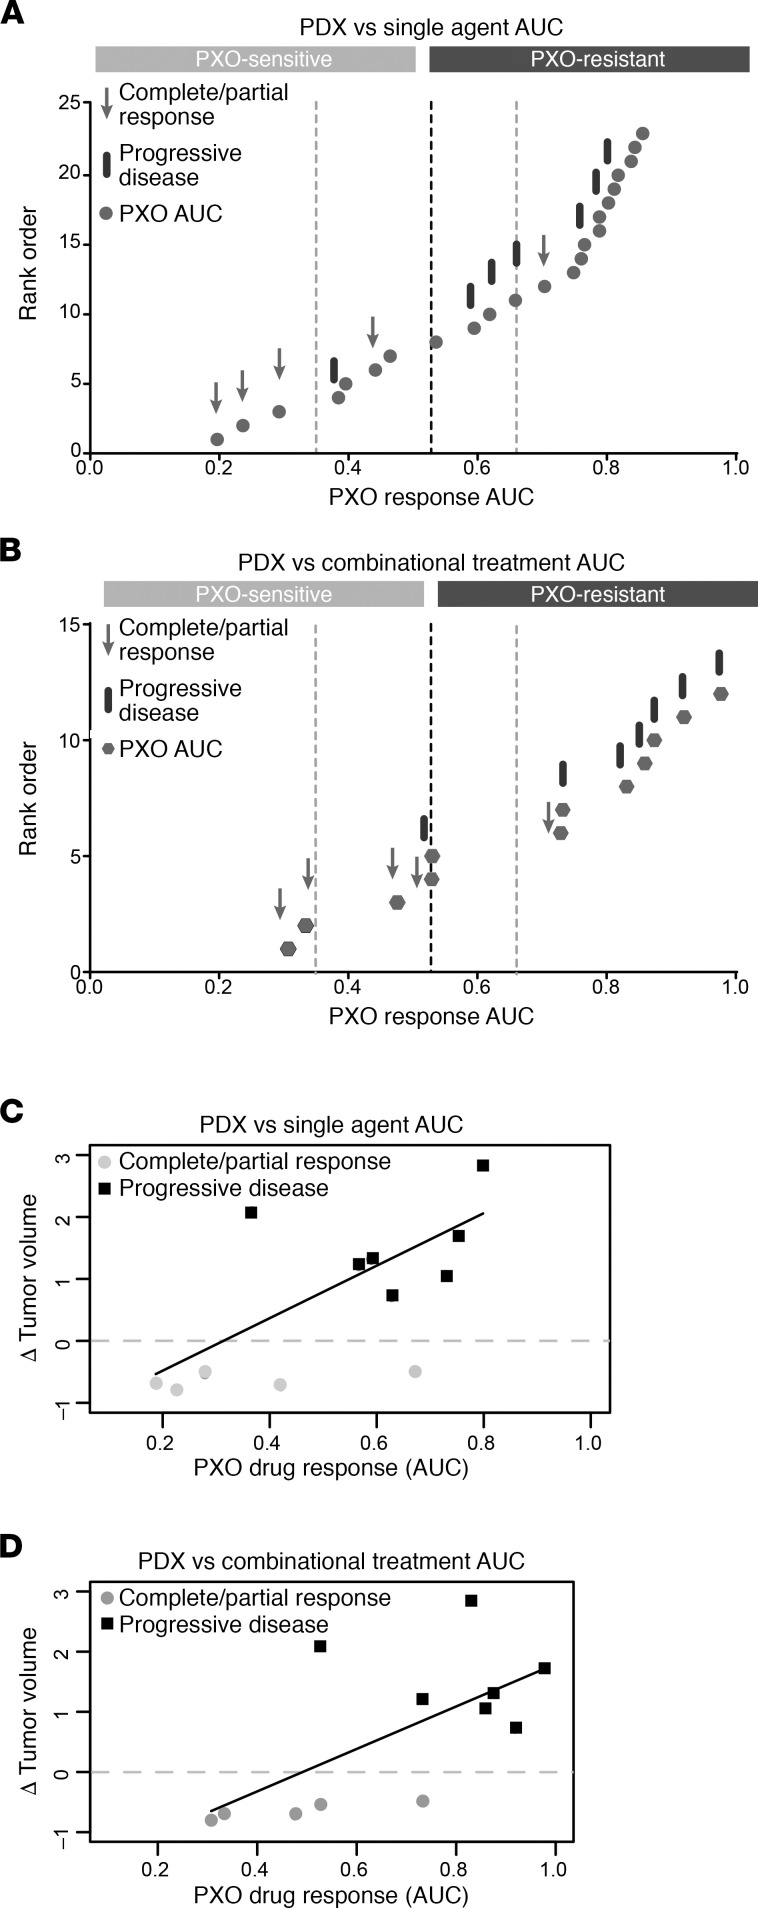
Figure 4. PXO AUC values can predict in vivo drug response.
(A) Jenks Natural Break analysis of AUC values for PXO drug responses to single agents plotted as rank order versus normalized AUC; dashed lines represent thresholds for separation of groups calculated by Jenks analysis. For each drug combination tested in PDX models, the component agent with lowest AUC was compared with PDX responses: arrows refer to the PDX models with PR or CR (responder), and bars correspond to PD (nonresponder). (B) Jenks Natural Break analysis on PXO responses to combinational treatments as represented by normalized AUC values. Dashed lines represent thresholds for separation of groups calculated by Jenks analysis. Arrows refer to matched PDX models that showed response to the drug combination, and bars refer to matched PDX models that did not show response to the drug combination. (C and D) Linear regression fit to determine correlation between PXO AUCs and PDX tumor volume changes. Gray dots, PDX responders; black squares, PDX nonresponders.

