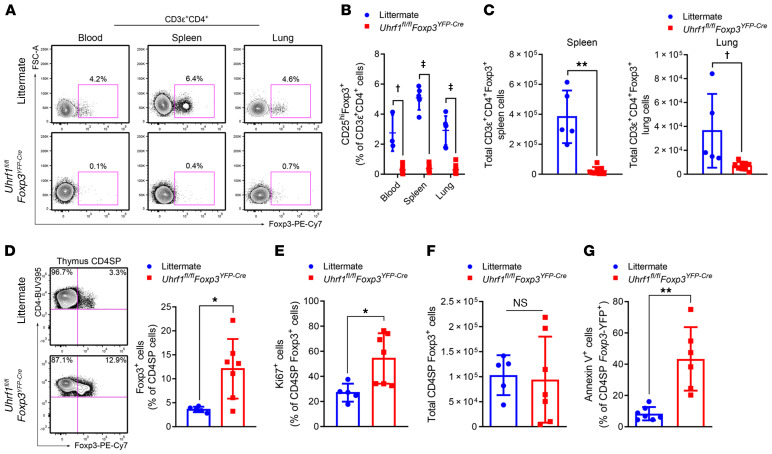
Figure 2. Tregs are reduced in the periphery of 3- to 4-week-old Treg-specific Uhrf1-deficient mice.
(A) Foxp3+ cells as a frequency of CD3ε+CD4+ cells in blood, spleen, and lung shown as representative flow cytometry contour plots. (B) CD25hiFoxp3+ cells expressed as a percentage of CD3ε+CD4+ cells for blood, spleen, and lung. For blood, n = 3 (Uhrf1+/flFoxp3YFP-Cre littermate) and n = 7 (Uhrf1fl/flFoxp3YFP-Cre); for spleen, n = 5 (littermate) and n = 9 (Uhrf1fl/flFoxp3YFP-Cre); for lung, n = 6 (littermate) and n = 10 (Uhrf1fl/flFoxp3YFP-Cre). (C) Total spleen and lung CD3ε+CD4+Foxp3+ cells. For spleen, n = 5 (littermate) and 8 (Uhrf1fl/flFoxp3YFP-Cre); for lung, n = 5 (littermate) and 10 (Uhrf1fl/flFoxp3YFP-Cre). (D) Thymic Foxp3+ cell frequency. Representative flow cytometry contour plots of CD4–single-positive (SP) thymocytes from littermate and Uhrf1fl/flFoxp3YFP-Cre mice. Foxp3+ cells are shown as a percentage of the CD4SP population. n = 5 (littermate) and n = 7 (Uhrf1fl/flFoxp3YFP-Cre). (E) Proliferating (Ki67+) cells as a percentage of CD4SP Foxp3+ thymocytes. n = 5 (littermate) and 7 (Uhrf1fl/flFoxp3YFP-Cre). (F) Total thymic Tregs. n = 5 (littermate) and 7 (Uhrf1fl/flFoxp3YFP-Cre). (G) Apoptotic (annexin V+) cells as a percentage of CD4SP Foxp3+ thymocytes. n = 7 (littermate) and 6 (Uhrf1fl/flFoxp3YFP-Cre). Summary plots show all data points with mean and SD. *P < 0.05; **P < 0.01; †q or P < 0.001; ‡q < 0.0001, NS, not significant by the 2-stage linear step-up procedure of Benjamini, Krieger, and Yekutieli with Q = 5% (B) or Mann-Whitney U test (C–G); exact q and P values are in Supplemental Data. FSC-A, forward scatter area. See Supplemental Table 3 for fluorochrome abbreviations.

