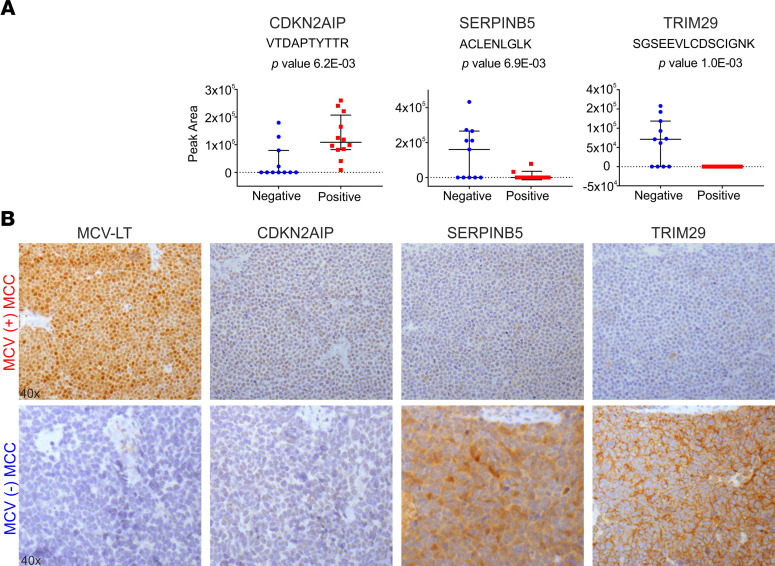
Figure 3. DPS can identify differentially expressed human peptides as potential biomarkers.
(A) Dot plots for the relative abundance of identified human peptides in MCV+ (red, n = 12) versus negative (blue, n = 11) MCC tumor samples. Data are shown as mean ± SD. P values were based on 2-sided equal variance Student’s t test. (B) IHC staining of MCC TMA. R10–115 and R15–03 are representative MCV+ (upper panel) and MCV– (lower panel) MCC cases, respectively. According to the IHC staining results, we detected SERPINB5 and TRIM29 in MCV– cases and in none of the MCV+ cases, as predicted by dMS analysis. MCV LT expression was detected using CM2B4 is a monoclonal antibody. Original magnification, 40×.

