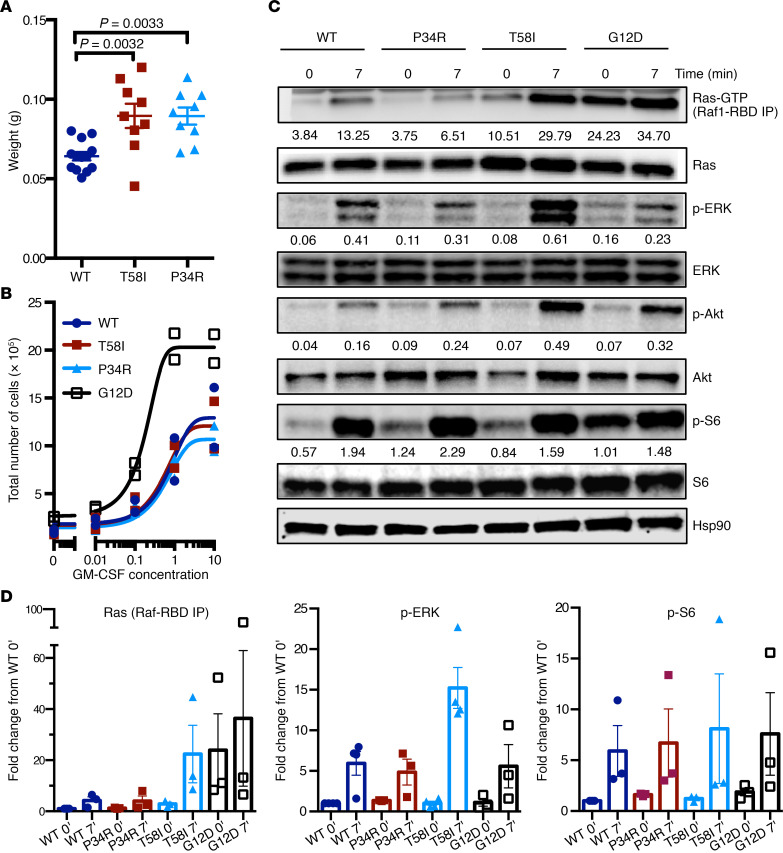
Figure 6. Splenomegaly, cytokine responses, and signal transduction in the BM cells of 9- to 16-week-old Mx1-Cre KrasLSL-T58I/+ and Mx1-Cre KrasLSL-P34R/+ mice.
(A) Spleen weights in WT, Mx1-Cre KrasLSL-T58I/+, and Mx1-Cre KrasLSL-P34R/+ mice. (B) Proliferation of WT, Mx1-Cre KrasLSL-T58I/+, Mx1-Cre KrasLSL-P34R/+, and Mx1-Cre KrasLSL-G12D/+ c-kit+; Mac1– progenitors exposed to a range of GM-CSF concentrations ex vivo. Two independent experiments were performed. (C) Western blot analysis of Mac1+ BM cells from age-matched mice of all 4 genotypes that were starved for 5–7 hours (time 0) and then stimulated with 20% FBS and 10 ng/mL GM-CSF for 7 minutes (time 7). The numbers below the bands indicate relative intensity of the band compared with the Hsp90 control from the same cell lysate. Representative images from 2 biological replicates are shown. (D) Ras-GTP, p-ERK, and p-S6 levels from at least 3 independent experiments are shown with the levels of each protein normalized to loading controls, and the data are presented as fold change from the WT time 0 (basal) condition. Statistical significance was evaluated by 1-way ANOVA with Tukey’s multiple comparisons test.

