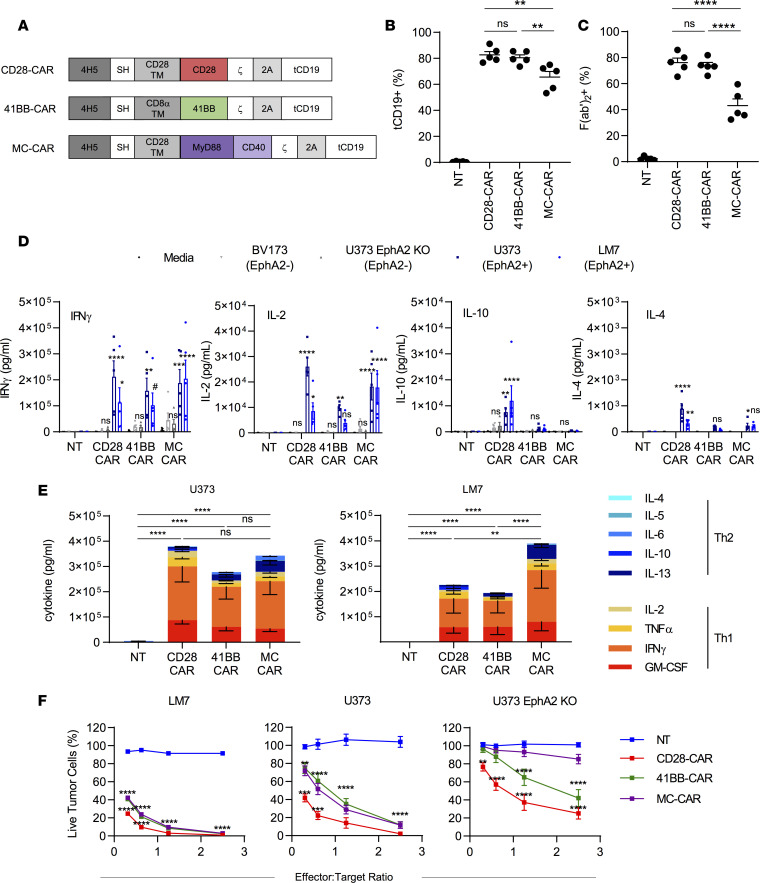
Figure 1. Generation and functional characteristics of CAR T cells.
(A) Scheme of EphA2-CAR constructs. (B) Summary plot of %tCD19+ T cells (n = 5, mean ± SEM, 1-way ANOVA with Tukey’s test for multiple comparisons). (C) Summary plot of %F(ab′)2-positive T cells (n = 5, mean ± SEM, 1-way ANOVA with Tukey’s test for multiple comparisons). (D) CAR T cell production of Th1 (IFN-γ and IL-2) and Th2 (IL-4 and IL-10) cytokines after 24-hour coculture at a 2:1 ratio against EphA2-positive (LM7, U373 WT) and EphA2-negative (BV173, U373 EphA2 KO) cell lines or in media alone (n = 5, mean ± SEM, 2-way ANOVA with Dunnett’s test for multiple comparisons, all statistical analysis is in comparison with NT cells). Dot colors: black, media; light gray, BV173 (EphA2 negative); dark gray, U373 EphA2 KO (EphA2 negative); dark blue: U373 (EphA2 positive); light blue, LM7 (EphA2 positive). (E) Summary plots of Th1 and Th2 cytokine production against EphA2-positive cell lines U373 and LM7 (n = 5, mean ± SEM, values were log transformed before 2-way ANOVA with Tukey’s test for multiple comparisons). (F) CAR T cells were incubated with increasing amounts of tumor cells for 24 hours, and the remaining live tumor cells were quantified with an MTS assay (2-way ANOVA with Tukey’s test for multiple comparisons, mean ± SEM, LM7: n = 4, U373 WT and U373 EphA2 KO: n = 9). For LM7 and U373, asterisks refer to statistical comparison of MC-CAR with NT and CD28-CAR with MC-CAR. For U373 EphA2 KO, asterisks refer to statistical comparison of 41BB-CAR with NT and CD28-CAR with NT. #P < 0.1; *P < 0.05; **P < 0.01; ***P < 0.001; ****P < 0.0001.

