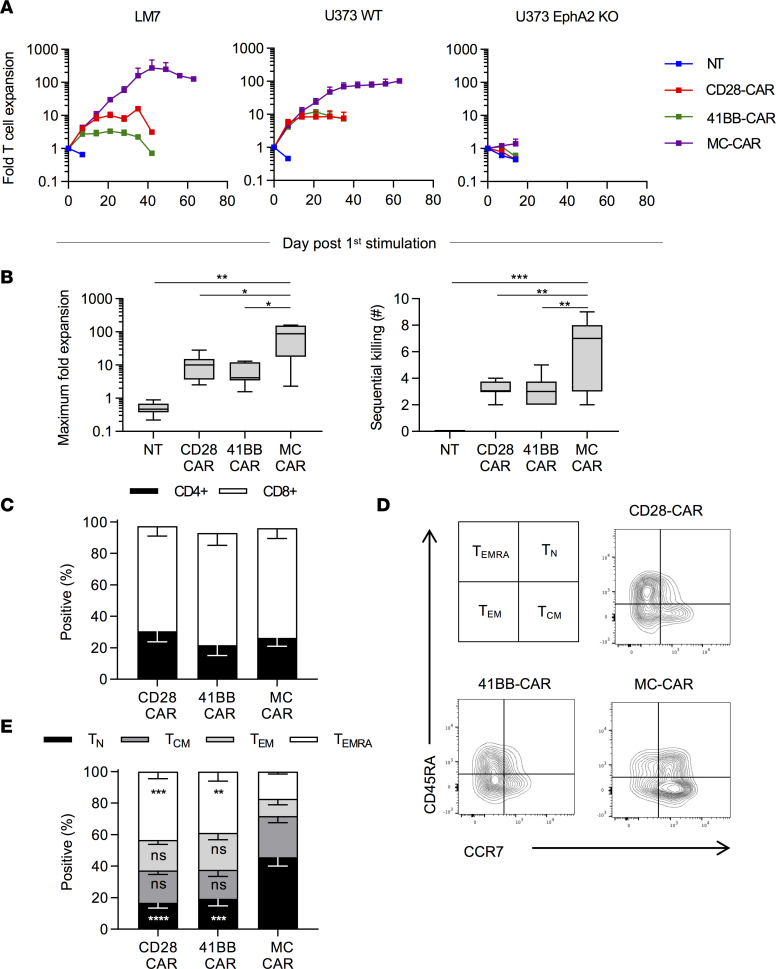
Figure 2. MC-CAR T cells outperform CD28 and 41BB in repeat stimulation assay.
T cells were cocultured with tumor cells at a 2:1 ratio with weekly restimulation against fresh tumor cells until they lost their effector function and no longer killed all the tumor cells. (A) Average expansion of CAR T cells against EphA2-positive (U373 and LM7) and U373 EphA2 KO cell line (mean ± SEM, LM7: n = 4; U373: n = 8 [NT, CD28, MC], n = 4 [41BB]; U373 KO: n = 8 [NT, CD28, MC], n = 6 [41BB]). (B) Summary of the maximum expansion CAR T cells from individual donors achieved against EphA2-positive tumor cells and the maximum number of times CAR T cells were able to kill fresh EphA2-positive tumor cells (n = 12 [NT, CD28, and MC], n = 8 [41BB]; median and quartiles, 1-way ANOVA with Tukey’s test for multiple comparisons). T cells were phenotyped 7 days after stimulation with U373. (C) Summary plot of CD4/CD8 composition after stimulation with U373 (n = 3, mean ± SEM). (D) Scheme for phenotyping T cells and representative flow cytometry plots of CCR7 and CD45RA expression on CAR T cells after stimulation with U373. (E) Summary plot of T cell phenotype after stimulation with U373 (n = 4, mean ± SEM, 2-way ANOVA with Tukey’s test for multiple comparisons). All statistical tests were performed in comparison with MC-CAR T cells (*P < 0.05; **P < 0.01; ***P < 0.001; ****P < 0.0001).

