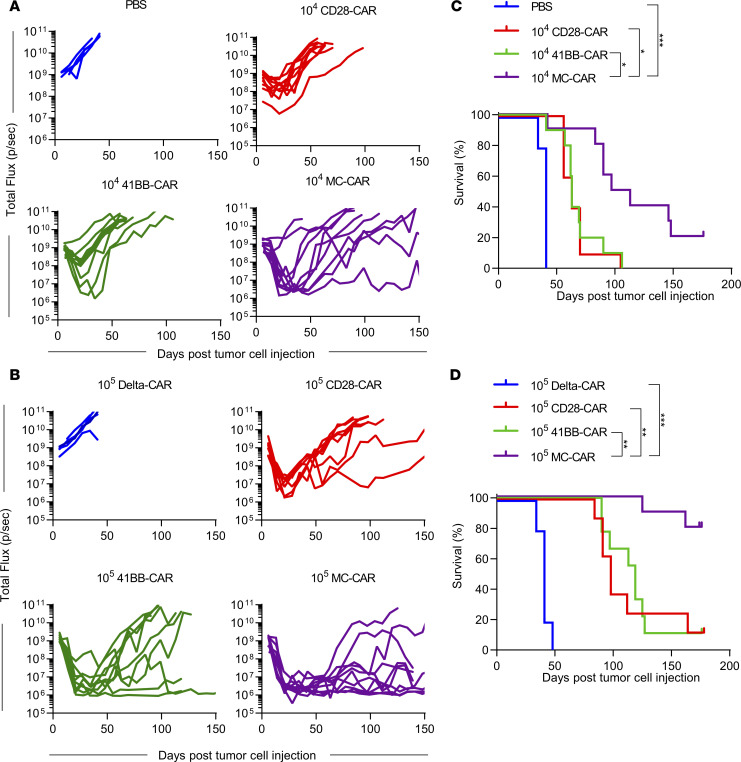
Figure 3. MC-CAR T cells exhibit superior antitumor activity in i.p. LM7 model.
(A–D) NSG mice were injected with 1 × 10⁶ LM7-ffLuc i.p. One week later, mice were injected with 1 × 10⁴ or 1 × 10⁵ CD28-, 41BB-, or MC-CAR T cells. PBS and 1 × 10⁵ Delta-CAR T cells were used as controls. (A) Total flux from tumor cells in all mice treated with 1 × 10⁴ EphA2 CAR T cells (PBS: n = 5; CD28, 41BB, MC: n = 10). (B) Total flux from tumor cells in all mice treated with 1 × 10⁵ EphA2 CAR T cells (Delta: n = 5, CD28: n = 8, 41BB: n = 9, MC: n = 10). (C and D) Kaplan-Meier survival analysis of mice treated with 1 × 10⁴ (C) or 1 × 10⁵ (D) EphA2 CAR T cells (log-rank Mantel-Cox test with Bonferroni’s correction for multiple comparisons; *P < 0.05; **P < 0.01; ***P < 0.001). Experiments were repeated twice with CAR T cells generated from 2 different healthy donors.

