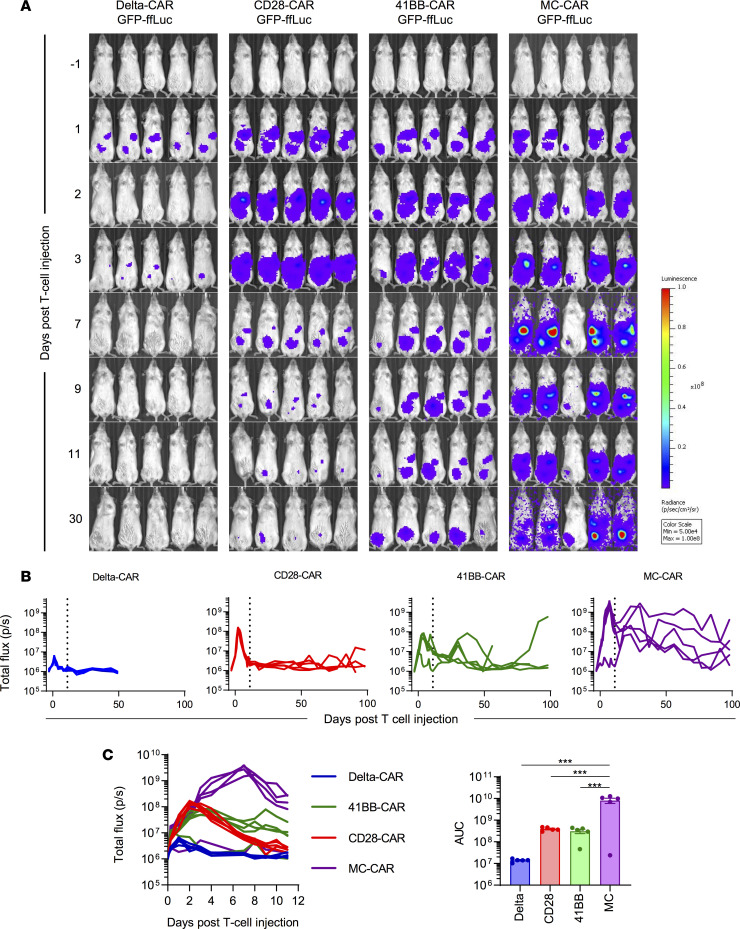
Figure 4. MC-CAR T cells expand more and persist longer in vivo than CD28 or 41BB CAR T cells.
NSG mice were injected with 1 × 10⁶ LM7 i.p. One week later they were injected with 1 × 10⁵ T cells that had been doubly transduced to express a CAR and ffLuc. (A) Bioluminescence imaging corresponding to T cell expansion/persistence after injection into i.p. LM7-bearing mice (n = 5 mice/group). (B) Quantitative bioluminescence data from LM7-bearing mice treated with CAR-ffLuc T cells. (C) Bioluminescence data until day 11 after T cell injection (denoted by vertical line in B), corresponding to peak of T cell expansion, as well as area under the curve (AUC) analysis to evaluate CAR T cell exposure (n = 5, mean ± SEM, 1-way ANOVA with Tukey’s test for multiple comparisons, ***P < 0.001).

