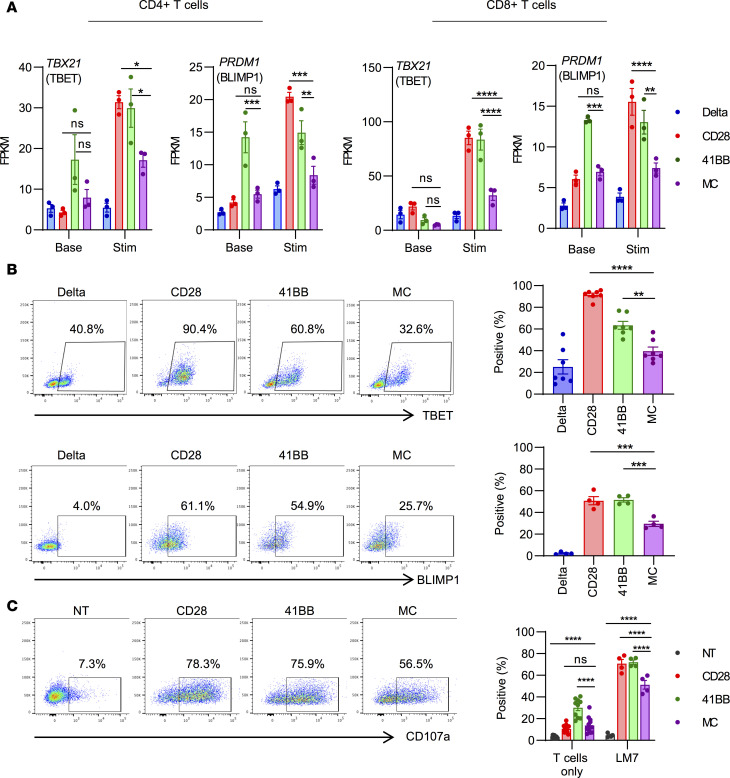
Figure 6. MC-CAR T cells retain a less differentiated phenotype postactivation.
(A) CAR T cells from 3 healthy donors were taken directly from culture or first stimulated with LM7 tumor cells for 24 hours before being sorted into CD4+CAR+ and CD8+CAR+ subsets. RNA was extracted from sorted cells and sequenced on an Illumina NovaSeq platform. Expression of PRDM1 (encodes BLIMP1) and TBX21 (encodes TBET) at baseline and after 24-hour stimulation with LM7 in CD4+ (left) and CD8+ (right) T cells (n = 3, mean ± SEM, 2-way ANOVA with Tukey’s test for multiple comparisons). FPKM, fragments per kilobase of transcript per million mapped reads. (B) CAR T cells were stimulated with rhEphA2 protein for 24 hours before intracellular staining for the transcription factors TBET and BLIMP1. Representative flow plots and summary of expression for all donors are shown (TBET: n = 7, BLIMP1: n = 4, mean ± SEM, 1-way ANOVA with Tukey’s test for multiple comparisons). (C) T cells were incubated with LM7 tumor cells at a 1:2 E/T ratio for 5 hours in the presence of GolgiStop and stained for CD107a, a surrogate marker for degranulation. Representative flow plots and summary expression for all donors are shown (T cells only: n = 13, T cells vs. LM7: n = 4, mean ± SEM, 2-way ANOVA with Tukey’s test for multiple comparisons). All statistical tests were performed in comparison with MC-CAR T cells (*P < 0.05; **P < 0.01; ***P < 0.001; ****P < 0.0001). Enlarged versions of A and B are provided in Supplemental Figures 22 and 23.

