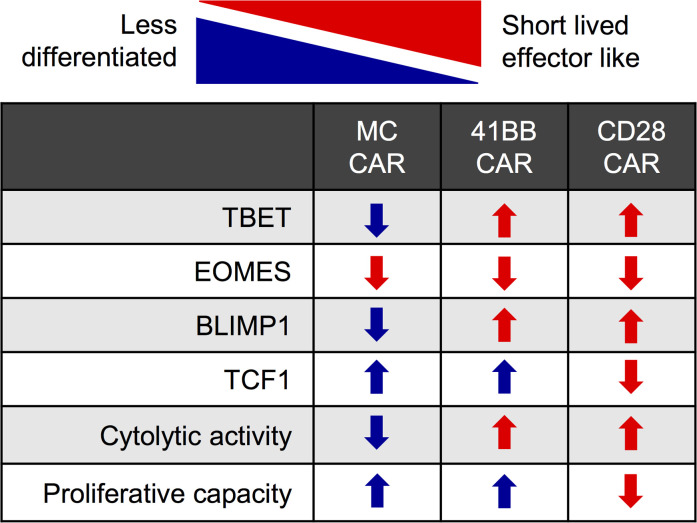
Figure 7. Graphical summary of results.
Transcription factors drive T cell differentiation, which is accompanied by phenotypic changes. A graphical description of CD28-, 41BB-, and MC-CAR T cells is shown. Blue indicates phenotype consistent with less differentiation, red with more differentiation. Up arrows indicate higher expression, down arrows lower expression.

