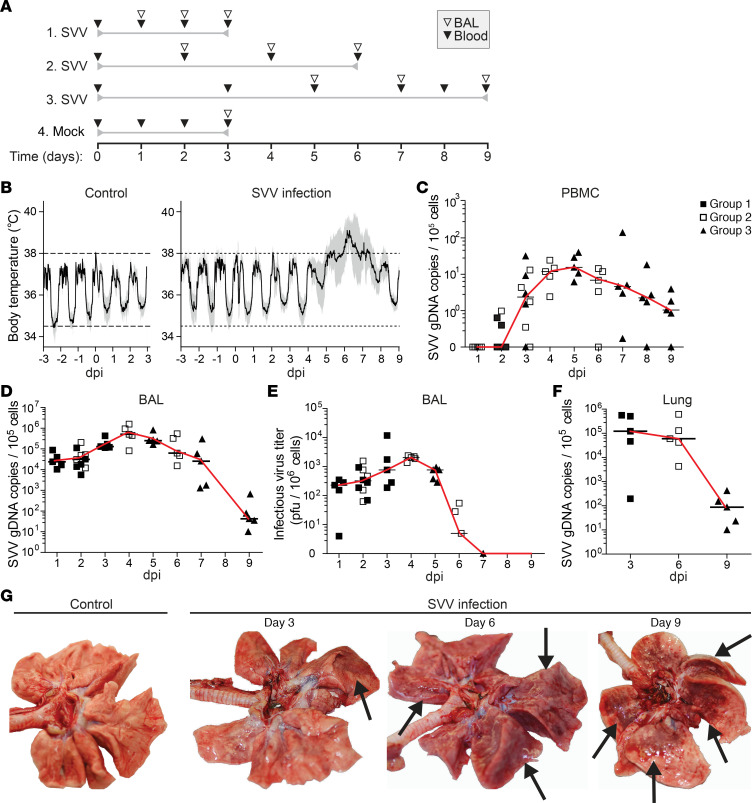
Figure 1. SVV infection of cynomolgus macaques causes transient fever and fulminant pneumonia.
(A) Experimental design. Time relative to mock or SVV infection (day 0) is indicated. Sampling time points and type are indicated by open (BAL) and closed (blood) inverted triangles. (B) Fluctuations in body temperature after mock (control) and SVV infection. Horizontal dashed lines, normal range in body temperature. Black solid line, mean. Gray filled area, 95% CI. Control, n = 5; SVV infection, n = 15 for 1–3 dpi, n = 10 for 4–6 dpi, and n = 5 for 7–9 dpi. (C, D, and F) SVV DNA qPCR on PBMC (C), BAL cells (D) and lung tissue (F). Data are expressed as SVV genomic DNA (gDNA) copies per 1 × 10⁵ cells. (E) Infectious SVV titers in BAL cells. (C–F) Symbols indicate values of individual animals (group 1, filled square; group 2, open square; group 3, filled triangle); black horizontal line indicates median. (G) Photographs of lungs from control and SVV-infected animals. Arrows indicate lesions.

