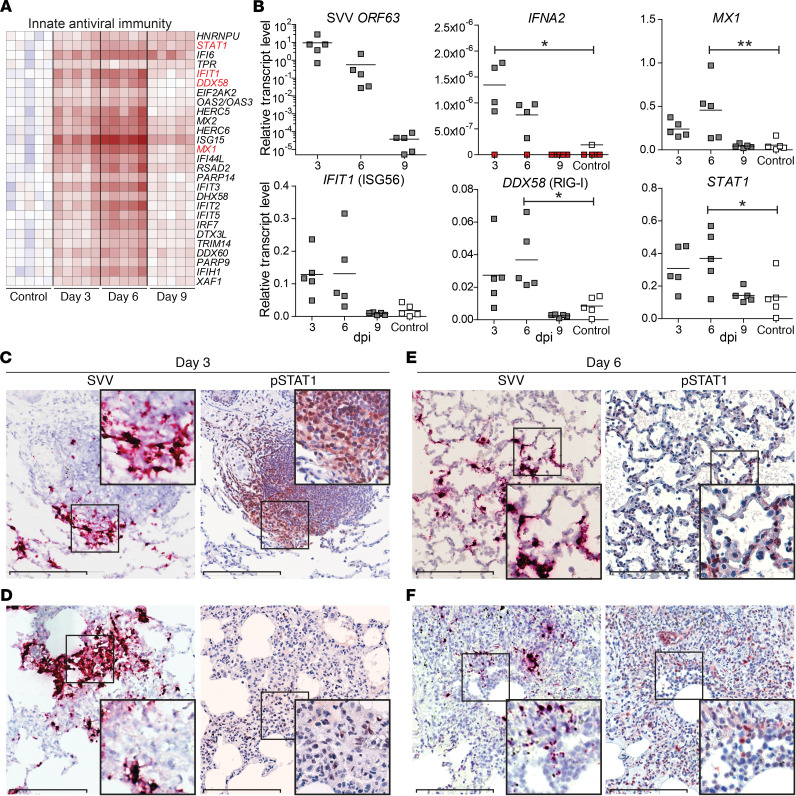
Figure 3. Innate immune responses in lung tissue of SVV-infected cynomolgus macaques.
(A) Heatmap showing DEGs at 3 dpi involved in innate antiviral immunity. Log2-fold change in gene expression is shown. Color gradient: blue, –3; white, 0; red, +6. (B) qPCR analysis of the indicated transcripts with data expressed as relative transcript level compared with GAPDH using the 2–ΔCt method. Horizontal line indicates mean. Red squares indicate undetectable. *P < 0.05, **P < 0.01 by 1-way ANOVA and Bonferroni’s correction. (C–F) Consecutive lung sections stained for SVV ORF63 RNA (purple) by ISH and pSTAT1 (red) by IHC and counterstained with hematoxylin (blue) at 3 dpi (C and D) and 6 dpi (E and F). Enlargement of areas indicated by black boxes are shown. Scale bars: 200 μm.

