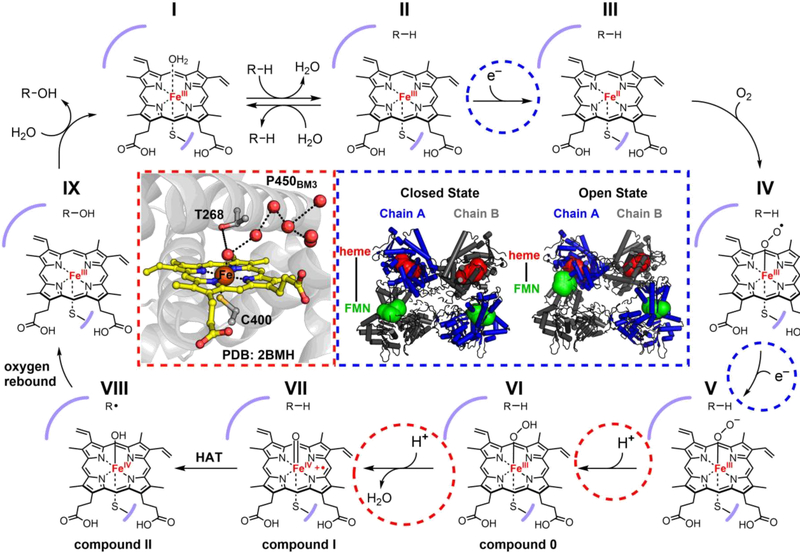
Figure 2.
Mechanism of P450-catalyzed hydroxylation. The red inset (left) depicts the active site of the P450BM3 heme domain in the substrate-free crystal structure (PDB: 2BMH). The conserved T268 residue sits directly above the heme, in close contact with an ordered water network (red spheres) for the proton-transfer steps. The blue inset (right) shows the conformational shift between the closed and open states of the full-length P450BM3 dimeric complex (models derived from cryo-EM maps EMD: 20785 and EMD: 20786), which brings the heme (red spheres) from one monomer and FMN (green spheres) from the other in close proximity for the electron transfer steps.

