Figure 1.

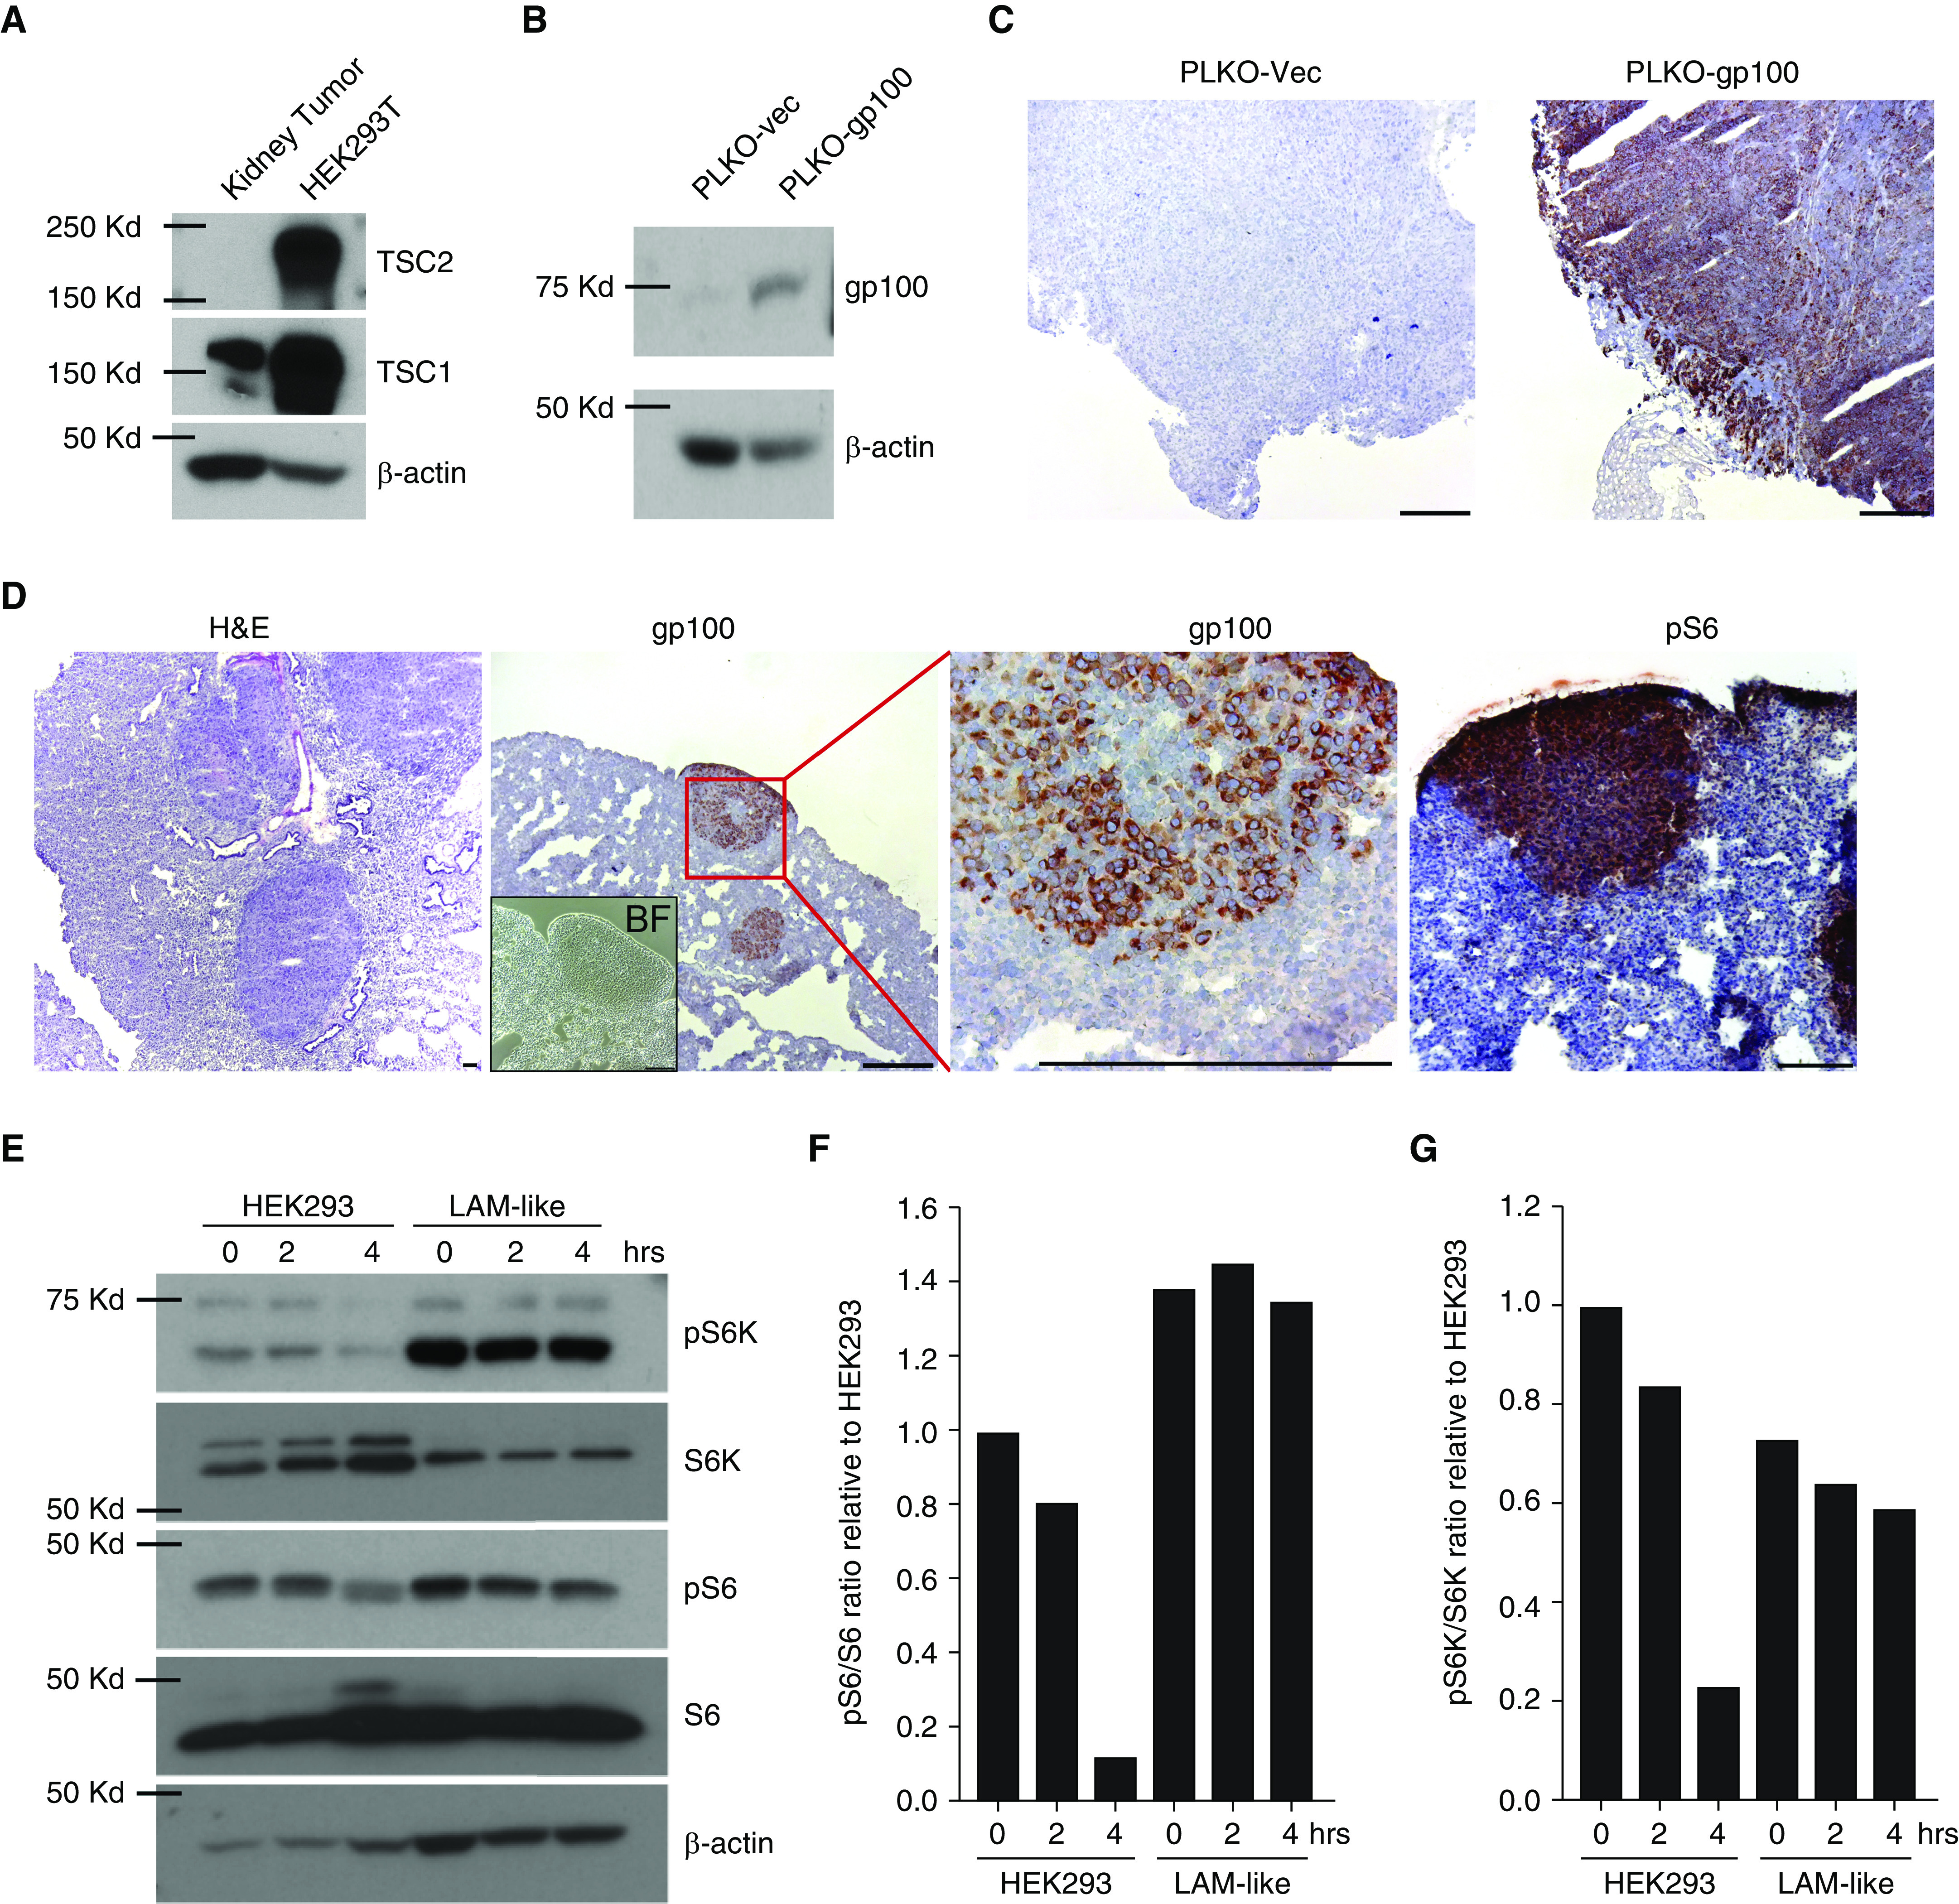
Generation and validation of lymphangioleiomyomatosis (LAM)-like cells. This figure displays the LAM-like features of target cells used for experiments throughout the article. (A) TSC1 and TSC2 expression is shown as found in kidney tumor cells isolated from 21-month-old Tsc2+/− mice. Human embryonic kidney (HEK) 293T cells served as a positive control. (B) Lack of gp100 expression by (PLKO-vec) control-transfected, and apparent gp100 expression by mouse gp100-transfected, Tsc2− kidney tumor cells. (C) Absence of gp100 expression in subcutaneous tumors from SCID-bg mice injected with Tsc2− kidney tumor cells, versus expression by gp100-transfected cells in vivo. (D) LAM-like cells from gp100+Tsc2− subcutaneous tumors and reinjected into SCID-bg mice via tail vein formed pulmonary tumors in 1 month; sections were stained with hematoxylin and eosin (H&E, left panel) and imaged in bright field (inset), and stained for gp100 (middle panels) or pS6 expression (right panel). (E) To identify constitutive mTOR activation measured as phosphorylation under nutrient deprivation in LAM-like cells, HEK293 and LAM-like cells were treated with normal- and amino acid–deprived FBS for 2 and 4 hours. Lysates were analyzed by Western blot using antibodies against indicated proteins. pS6 and pS6K bands from E were quantified and normalized to S6 and S6K, respectively, using ImageJ software. Relative ratios of quantified band intensity of (F) pS6 to S6 and (G) pS6K to S6K are shown in bar graphs. Scale bar: 100 μm. BF = bright-field; bg = beige; gp100 = glycoprotein 100; pS6 = phospho-S6; pS6K = phospho-S6 kinase; SCID = severe combined immunodeficiency; vec = vector.
