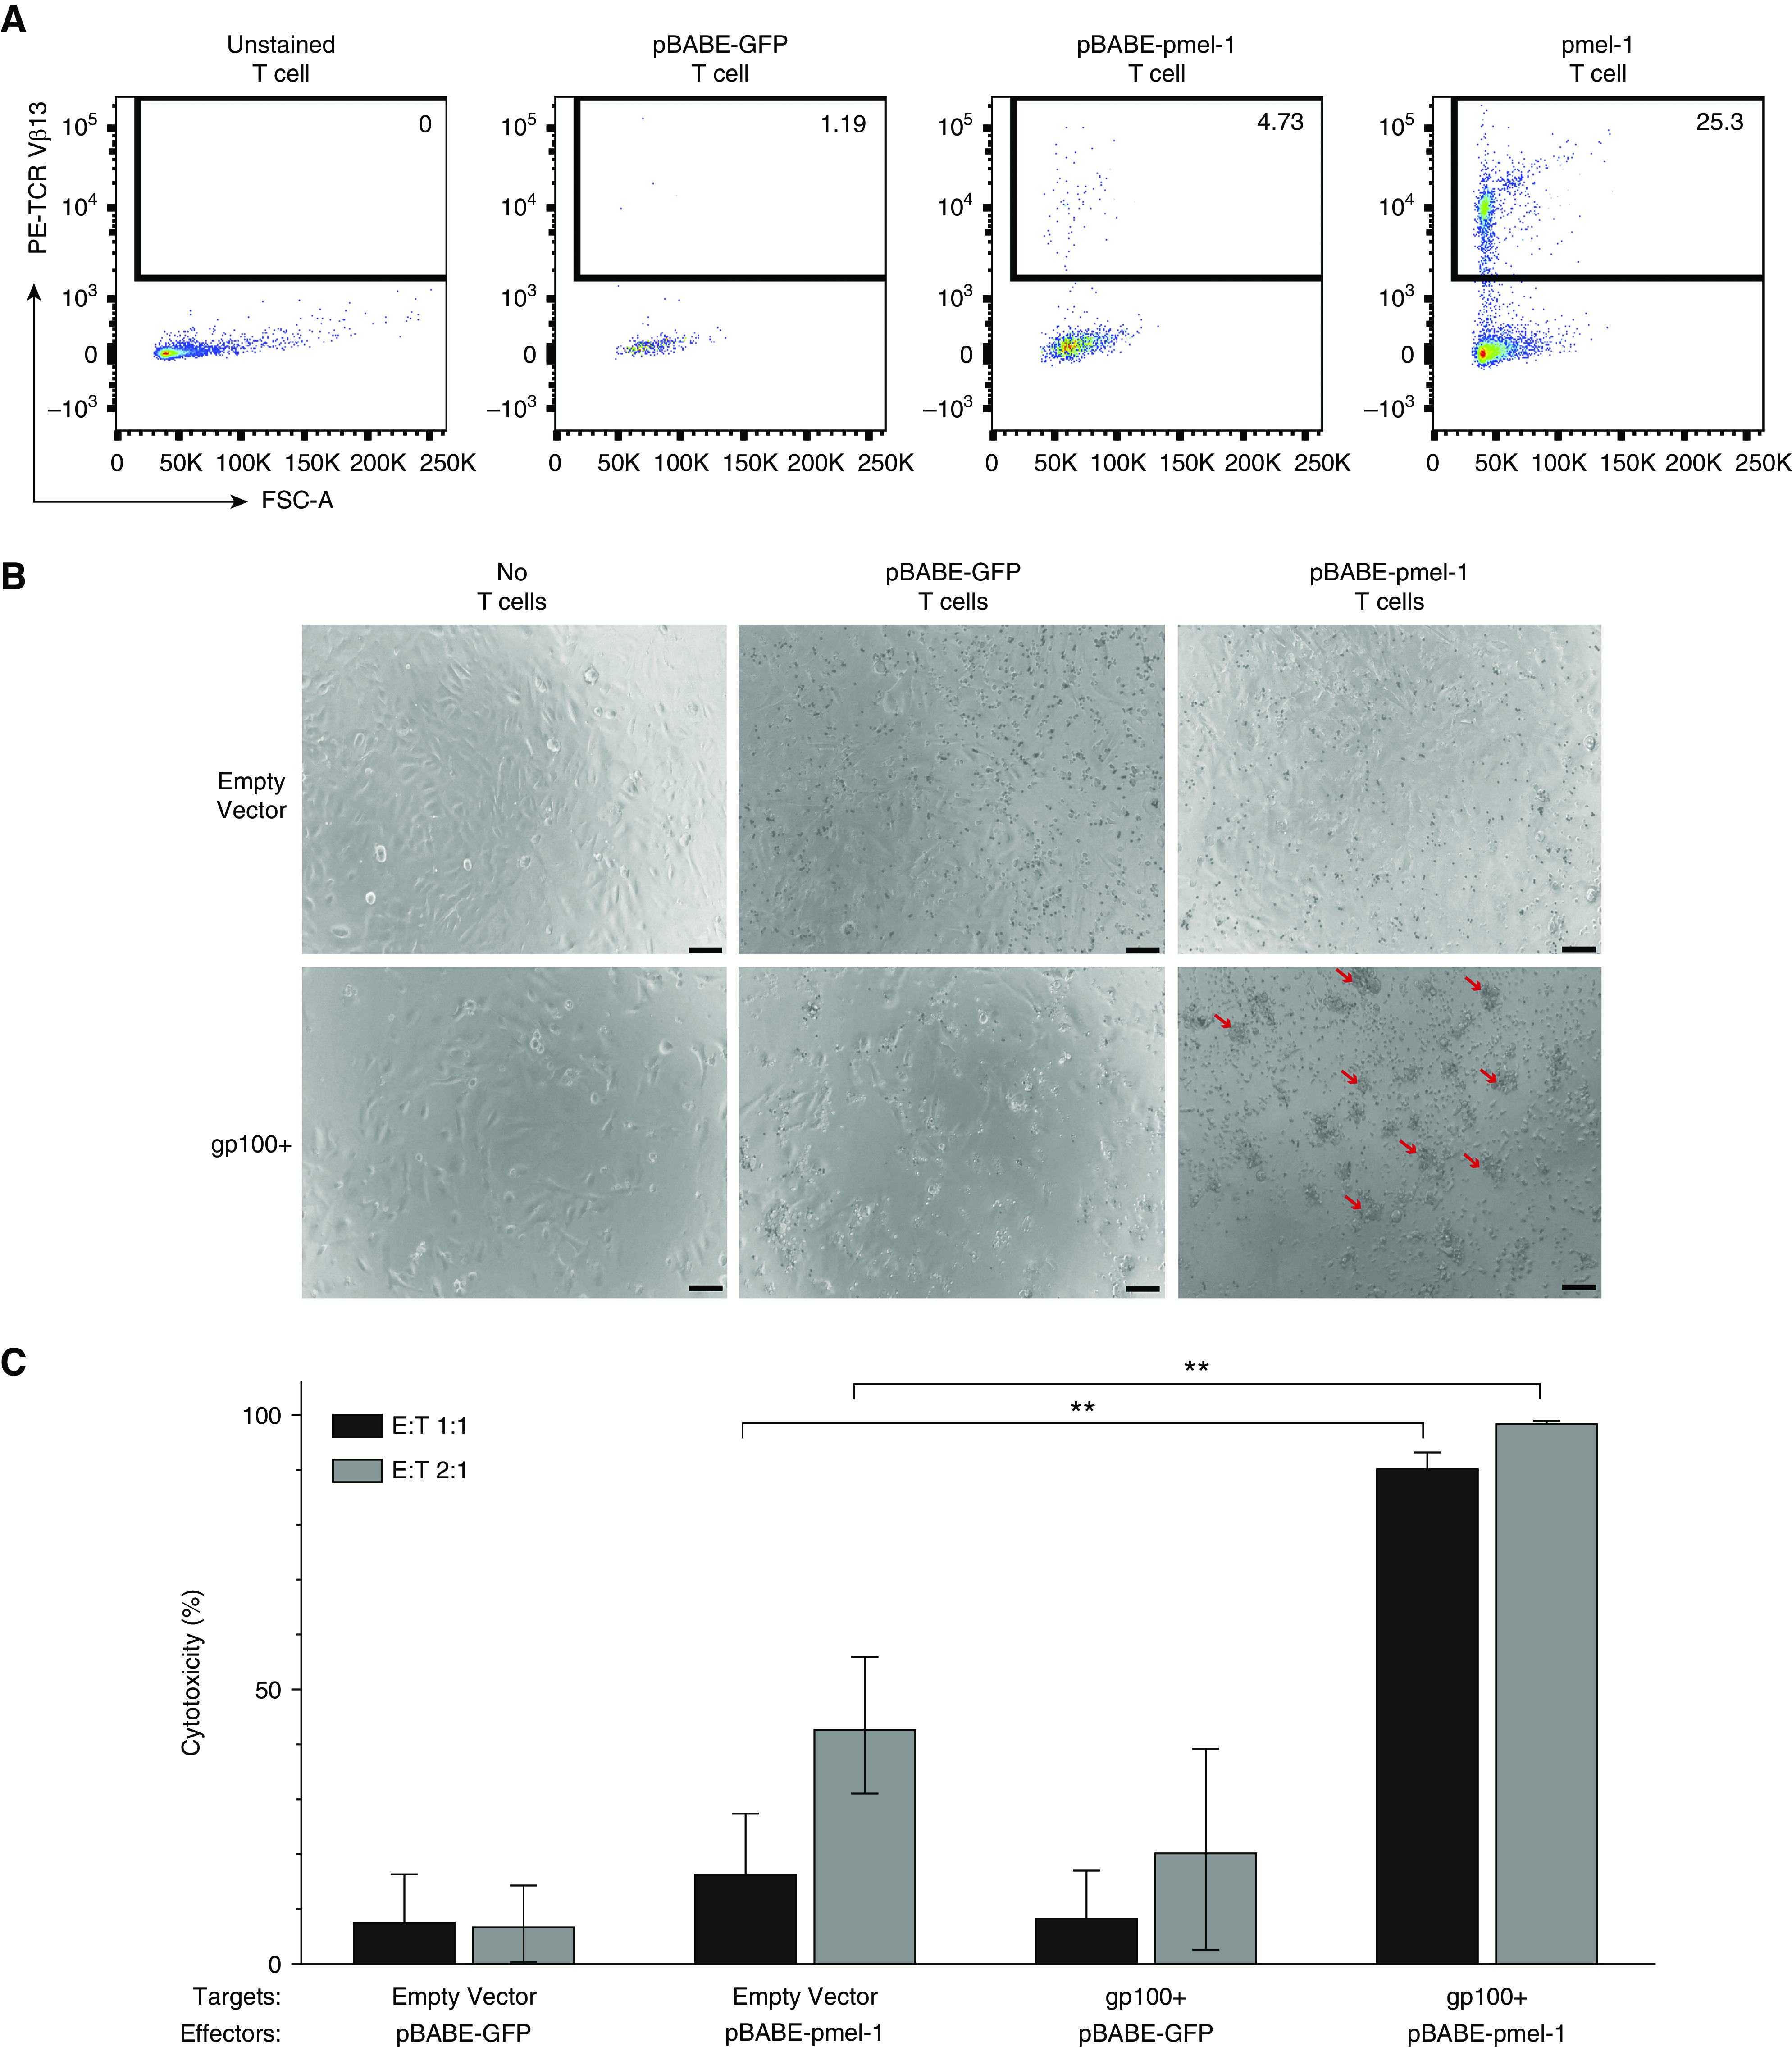
Figure 2.

pmel-1–transduced T cells showed reactivity toward LAM-like cells in vitro. The expression and activity of a gp100-reactive TCR was analyzed in vitro. (A) Flow analysis of TCRVβ13 expression for the pmel-1 TCR in unstained (−control), pBABE-GFP vector-transduced, and pBABE-pmel-1–transduced mouse T cells, and T cells from pmel-1 transgenic mice (+control), showing TCR expression only in the two latter groups. (B) Vector control Tsc2− kidney tumor cells and gp100+ Tsc2− LAM-like cells pulsed with additional gp100 peptide were co-cultured with pBABE-GFP vector and pBABE-pmel-1–transduced T cells at 1:1 ratio. Bright-field images taken 48 hours after co-culture. Red arrows: clusters are visible only in combinations of gp100-reactive T cells and gp100+ target cells, indicative of ongoing cytotoxicity. (C) Cytotoxicity quantified: target cells remaining after 48 hours were quantified relative to target cell monocultures. With some background cytotoxicity observed, pmel-1–transduced T cells showed significant cytotoxicity toward gp100+ targets at 1:1 and 2:1 effector:target (E:T) ratios (represented as mean ± SD). N = 3. **P ≤ 0.01 (two-way ANOVA with Tukey’s multiple comparisons test). Scale bars: 50 μm. FSC-A = forward scatter area.
