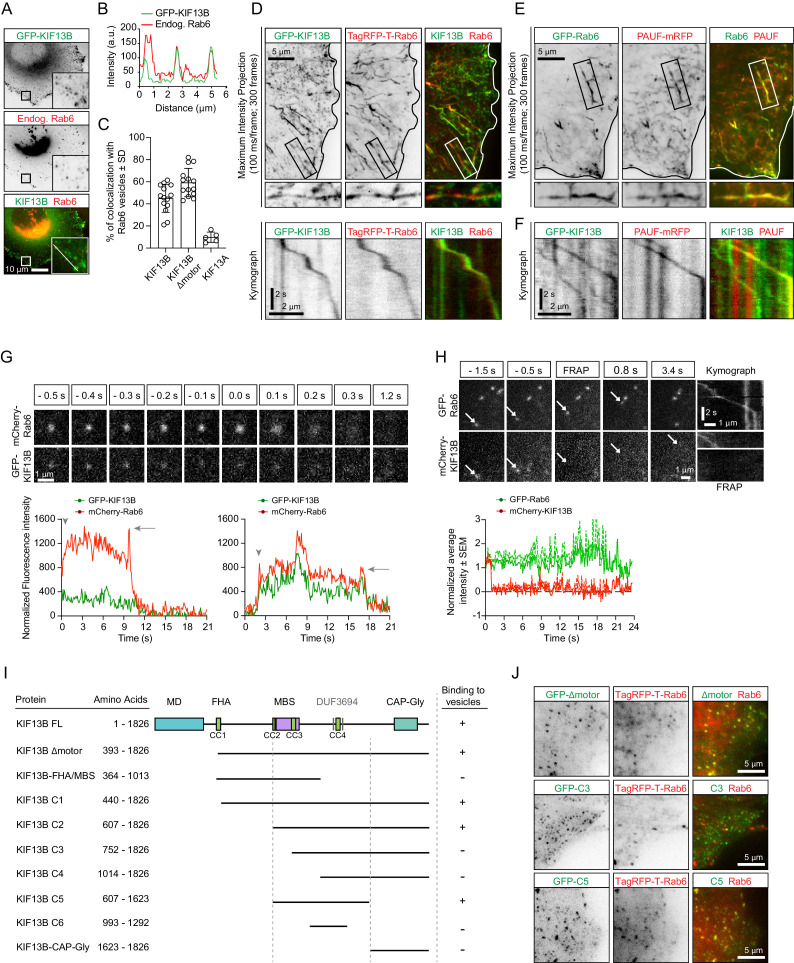
Figure 1. KIF13B localizes to Rab6-positive secretory carriers.
(A) Immunofluorescence images of a HeLa cell expressing GFP-KIF13B and stained for endogenous Rab6. The insets correspond to magnified views of the boxed areas. (B) Signal intensity profile of GFP-KIF13B (green) and endogenous Rab6 (red) along the white line in panel A. (C) Quantification of the percentage of TagRFP-T labeled Rab6A vesicles colocalizing with GFP-KIF13B, GFP-KIF13B Δmotor and GFP-KIF13A. n = 14 (GFP-KIF13B, GFP-KIF13B Δmotor) and n = 5 cells (GFP-KIF13A). (D) Maximum intensity projections (300 consecutive frames, 100 ms interval) illustrating imaging of live HeLa cells expressing GFP-KIF13B and TagRFP-T-Rab6A using TIRFM. Magnifications of the boxed area and kymographs illustrating the movement of co-labeled vesicle are shown below. (E) Maximum intensity projections with magnified views of the boxed areas illustrating TIRFM imaging of live HeLa cells transfected with GFP-Rab6A and PAUF-mRFP. (F) Kymographs illustrating the movement of vesicles labeled with GFP-KIF13B and PAUF-mRFP. (G) (Top) Frames from live TIRFM imaging showing the behavior of GFP-KIF13B and mcherry-Rab6A vesicles before and during fusion. 0.0 s corresponds to the sharp increase of fluorescent signal associated with vesicle docking at the plasma membrane. (Bottom) Two examples showing the average fluorescence intensity of a single vesicle labeled with GFP-KIF13B and mCherry-Rab6A plotted versus time. Vesicle appearance in the focal plane is indicated by an arrowhead. Arrow points to the peaks of fluorescence intensity prior to vesicle fusion with the plasma membrane. (H) (Top) TIRFM imaging combined with FRAP was performed in live HeLa cells containing exocytotic vesicles labeled for GFP-Rab6A and mCherry-KIF13B. The mCherry signal was photobleached (frames labeled FRAP) on moving vesicles labeled with GFP-Rab6A. Arrows indicate the same vesicle over time. Kymographs are shown to illustrate the absence of fluorescence recovery of mCherry-KIF13B on the vesicle. (Bottom) Quantification of the signal intensity of mCherry-KIF13B (red) on moving GFP-Rab6A vesicle (green) over time after FRAP. n = 6 vesicles in 4 cells. (I) Scheme of the GFP-KIF13B deletion constructs used in this study. The constructs were transfected in HeLa cells and colocalization with TagRFP-T-Rab6A-positive vesicles was determined by live cell imaging. The amino acid positions in KIF13B are indicated. MD, motor domain; FHA, forkhead-associated domain, MBS, MAGUK binding stalk; DUF, domain of unknown function; CC, coiled-coil. (J) Live images of HeLa cells expressing TagRFP-T-Rab6A and the indicated GFP-KIF13B deletion construct using TIRF microscopy.


