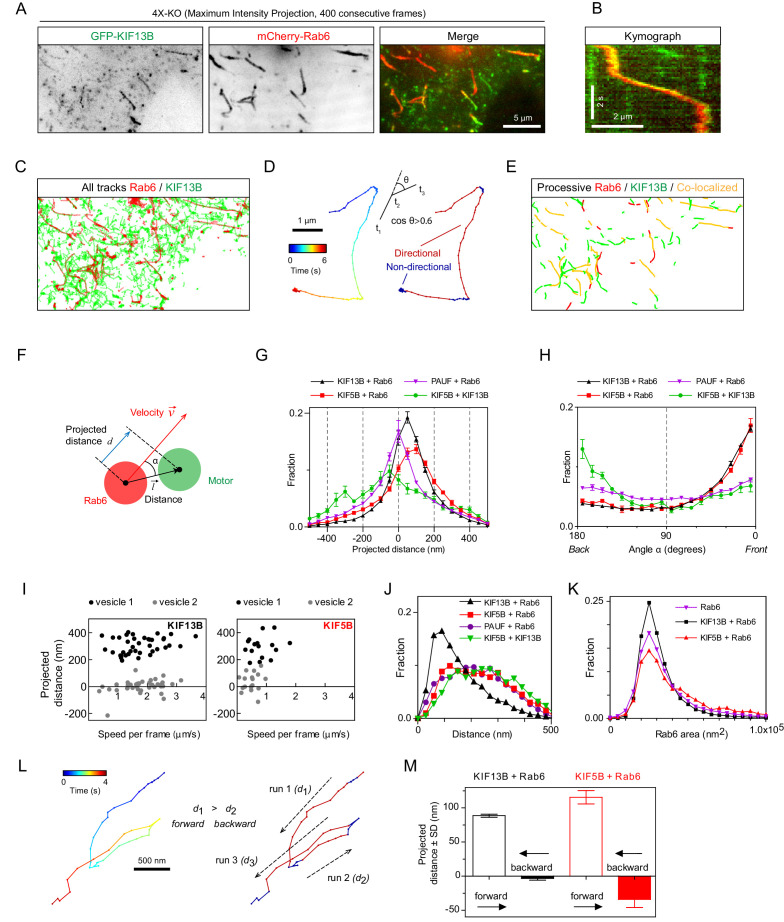
Figure 5. Kinesins exhibit distinct distributions on Rab6 vesicles.
(A) A representative example of maximum intensity projection (400 consecutive frames, 100 ms interval) of 4X-KO HeLa cells expressing mCherry-Rab6A and GFP-KIF13B to visualize events of Rab6-vesicle movement. Chromatic aberration of the red channel (mCherry-Rab6A) was corrected based on calibration, as illustrated in Figure 5—figure supplement 1A. (B) A kymograph from the movie shown in (A) illustrating the movement of a mCherry-Rab6A-labeled vesicle positive for GFP-KIF13B. (C) Automatically extracted trajectories of mCherry-Rab6A- and GFP-KIF13B-positive particles (detected independently) from the movie shown in (A). (D) Segmentation of trajectories into periods of random and directed motion. (Left) An example of Rab6 vesicle trajectory with color-coded time. (Middle) Definition of directional movements: Movement was classified as directional when a cosine of the angle θ between two consecutive velocity vectors (t3–t2 and t2–t1) was larger than 0.6. (Right) Final segmentation result with directional (red) and random (blue) periods of movement. (E) Directional segments of the tracks shown in (C), with colocalizing tracks labeled in yellow. (F) Schematics of the parameters used to characterize the distribution of two markers on the same vesicle. The projected distance d is calculated as a projection of distance between the centers of motor and cargo fluorescent signals () onto the axis defined by the instant velocity vector () of the cargo. The angle α is defined as the angle between the distance and velocity vectors. (G,H) The averaged histograms of the instantaneous projected distance (G) and the angle α (H) for GFP-KIF13B (black), KIF5B-GFP (red) with respect to mCherry-Rab6A, PAUF-mRFP with respect to GFP-Rab6A (purple) and for KIF5B-GFP with respect to mCherry-KIF13B (green). Each dot and bar represent the average and SEM over several independent experiments, each including 8–20 cells. KIF13B (N = 6 independent experiments, 82 cells, 11333 runs, 55129 time points), KIF5B (N = 6, 79 cells, 2826 runs, 10023 time points), KIF5B and KIF13B (N = 7, 89 cells, 1558 runs, 4371 time points) and PAUF (N = 2, 20 cells, 5807 runs, 21359 time points). (I) Plots of projected distance between Rab6A and KIF13B (left) or KIF5B (right) signals against speed for four different vesicles/runs (two different vesicles with distinct maximum projected distances, likely reflecting different vesicle sizes, are shown for each kinesin). (J,K) Histograms of the distance between the indicated markers (J) and Rab6A area (K) averaged per run and pooled together for all experiments. Same statistics as in (G,H). (L) Extraction of opposite polarity runs from Rab6 vesicle trajectories. On the left, an example of a trajectory with color-coded time; on the right, the same trajectory where the color denotes movement characteristics, directed (red) or random (blue). For each processive segment (run) the average direction of the velocity vector (dashed arrows) and average projected distance value (di) are calculated. Within one trajectory, the algorithm searches for all possible pair combination and keeps only those where the average movement direction is opposite. Within each pair a run with the higher average projected displacement is assigned to be the ‘forward’ run and the other one the ‘backward’ run. (M) Instantaneous (per frame) projected displacements for pairs of opposite runs, average ± SEM for the denoted conditions. The data are the same as in (G–J); for KIF13B, 664 opposite run pairs found, 3262 forward and 3122 backward time points; for KIF5B, 83 run pairs, 289 forward and 274 backward time points.


