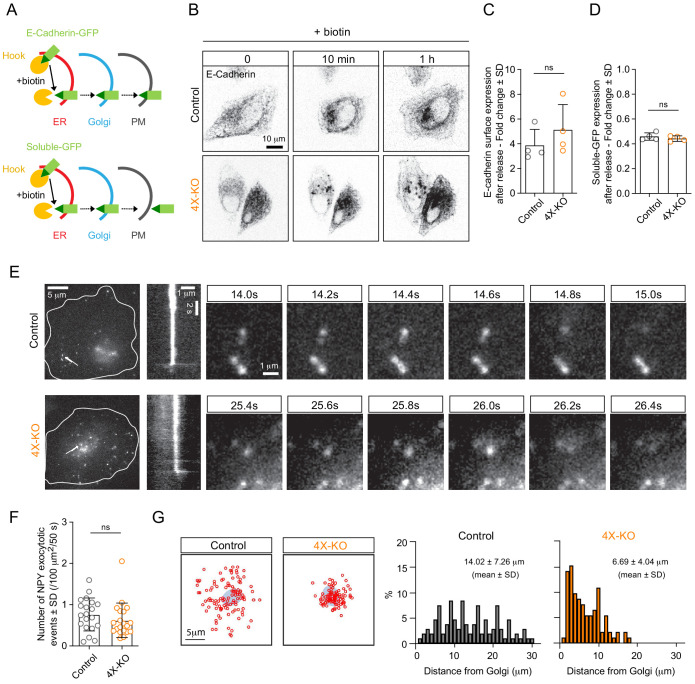
Figure 6. Kinesins control the spatial distribution but not the efficiency of exocytosis.
(A) A scheme depicting the RUSH assay used in this study. The interaction of SBP-GFP-E-Cadherin or soluble-GFP-SBP with streptavidin-KDEL (Hook) allows for the retention of E-Cadherin-GFP or soluble-GFP in the ER and their release for transport to the Golgi and the plasma membrane (PM) upon the addition of biotin, which competes with SBP for streptavidin binding. (B,C) RUSH assay was performed by expressing SBP-GFP-E-Cadherin and streptavidin-KDEL from the same bicistronic expression plasmid in control or 4X-KO HeLa cells. Cells were treated with biotin and imaged using time-lapse spinning-disk confocal microscopy (B, GFP-E-Cadherin signal) or subjected to surface staining with anti-GFP antibody to specifically label plasma membrane-exposed E-Cadherin followed by flow cytometry analysis (C). Plot shows the fold change of Alexa641 mean intensity (surface staining) in E-Cadherin expressing cells before and after biotin addition (1 hr). n = 4 independent experiments. Mann-Whitney U test: ns, no significant difference. (D) Control or 4X-KO HeLa cells expressing soluble-GFP-SBP and streptavidin-KDEL were treated with biotin and analyzed by flow cytometry to quantify the fold change of GFP mean intensity after biotin addition. n = 4 independent experiments. Mann-Whitney U test: ns, no significant difference. (E,F) TIRF microscopy was used to visualize and analyze exocytosis events in control or 4X-KO HeLa cells expressing NPY-GFP. Exocytotic events, defined by a fast burst of fluorescence followed by the disappearance of the signal were visually identified, confirmed by kymograph analysis and counted per cell and per surface area and per duration of movie (50 s) (F) n = 20 cells in two independent experiments. Mann-Whitney U test: ns, no significant difference. Individual time frames in (E) illustrate representative exocytotic events; their localization is indicated by white arrows, and the corresponding kymographs are shown. (G) Analysis of the spatial distribution of the NPY exocytotic events shown in (E). Schematized positions of NPY exocytosis events (red circles) compared to the position of the Golgi (blue) are shown on the left (sum of 20 cells) and frequency distributions of the distance between the center of the Golgi and the sites of exocytosis in control and 4X-KO HeLa cells are shown on the right. n = 109 and 93 tracks from 20 cells in two independent experiments.


