. 2020 Nov 16;9:e59157. doi: 10.7554/eLife.59157

Figure 5. CRMs with activity in the tail epidermis midlines for Phmamm.Msx, Phmamm.Klf1/2/4, Phmamm.Nkxtun3, Phmamm.Tox, and Phmamm.Dlx.c.

Representatives examples of X-gal staining at tailbud stages following P. mammillata embryos electroporation of P. mammillata genomic regions for Msx (A), Klf1/2/4 (B), Nkxtun3 (C), Tox (D), and Dlx.c (E). Embryos are shown in lateral view with dorsal to the top and anterior to the left. Scale bar: 50 μm.

Figure 5.

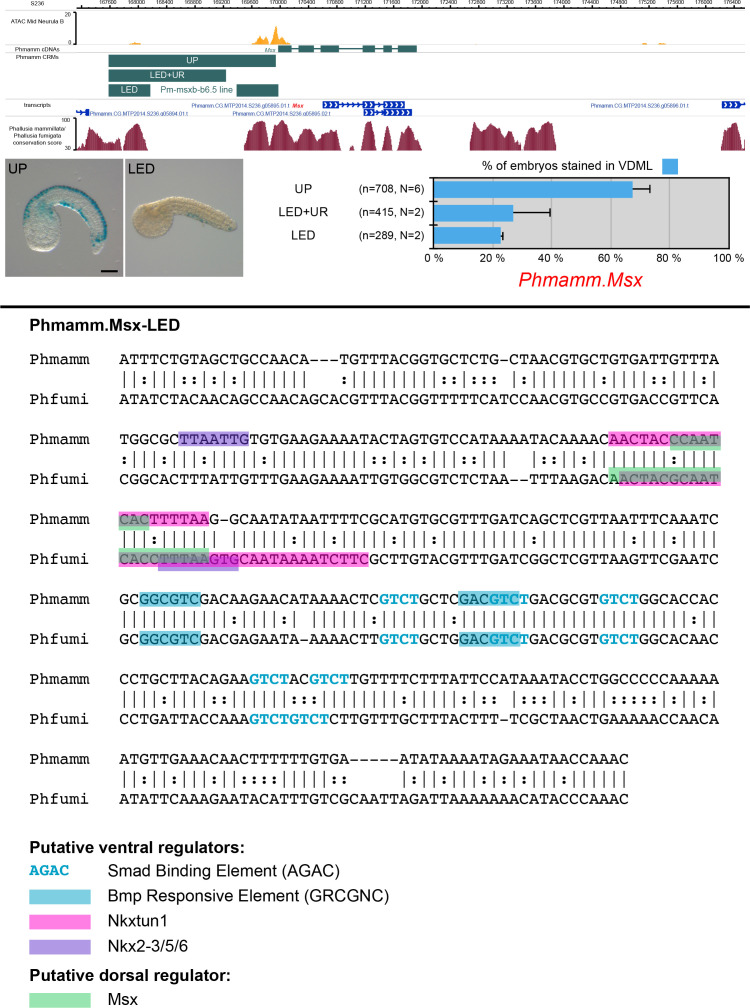
Figure 5—figure supplement 1. CRMs controlling Phmamm.Msx expression in VDML.

Figure 5—figure supplement 1.

(Top) Snapshot of the Phmamm.Msx locus depicting ATAC-seq profile at mid-neurula stages, tested genomic regions, transcript models and conservation between P. mammillata and P. fumigata (from https://www.aniseed.cnrs.fr/ and Dardaillon et al., 2020; Madgwick et al., 2019). Representative examples of X-gal staining at tailbud stages following P. mammillata embryos electroporation of P. mammillata genomic regions for Msx (Phmamm.Msx-UP (same picture as Figure 5A) and Phmamm.Msx-LED). Embryos are shown in lateral view with dorsal to the top and anterior to the left. Scale bar: 50 μm. Schematic representation of the various constructs and their activity at tailbud stages in VDML (blue) (n indicates the total number of embryos examined, N indicates the number of independent experiments). (Bottom) Identification of putative TFBS for candidate upstream factors in Phmamm.Msx-LED aligned with its counterpart from P. fumigata. All putative sites for ventral factors (SBE, BRE, Tbx2/3, Nkxtun1, Nkx2-3/5/6 and Irx.c) and dorsal factors (Msx and Su(H)/Rbpj) have been mapped, but only conserved sites are shown: 5 SBE, 2 BRE, 1 Nkxtun1, 1 Nkx2-3/5/6, and 1 Msx sites. When comparing with Ciinte.Msx-up10 (Figure 1—figure supplement 2), we found shared sites for direct activation by Bmp signaling (SBE and BRE), and for activation by Msx itself. However, sites for ventral TFs were different: Nkxtun1 and Nkx2-3/5/6 in Phmamm.Msx-LED and Irx.c and Tbx2/3 in Ciinte.Msx-up10. Note that the size of the highlighted site for of a given TF may vary depending on the matrix used.
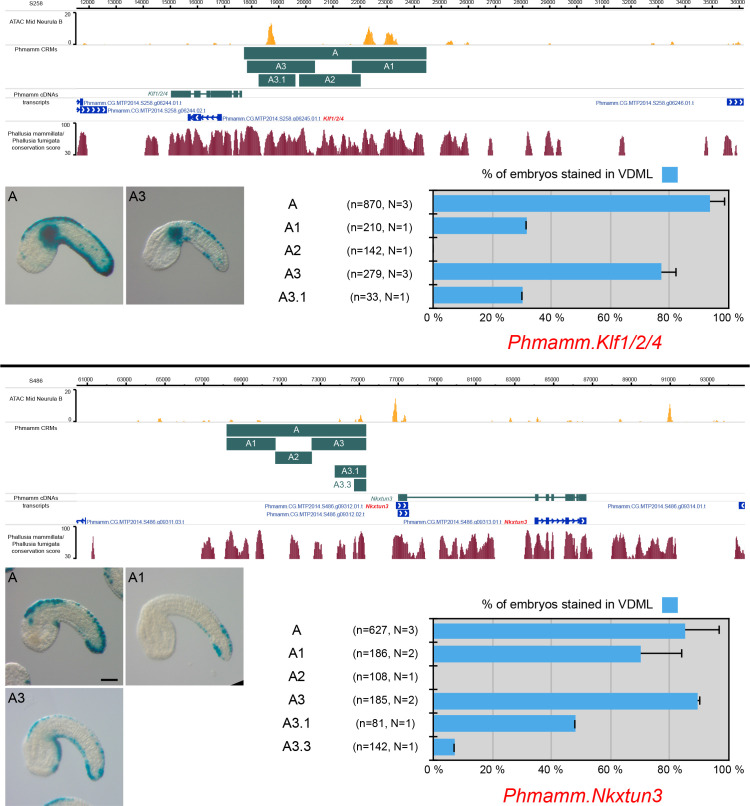
Figure 5—figure supplement 2. CRMs controlling Phmamm.Klf1/2/4 and Phmamm.Nkxtun3 expression in VDML.

Figure 5—figure supplement 2.

Snapshots of the Phmamm.Klf1/2/4 and Phmamm.Nkxtun3 loci depicting ATAC-seq profile at mid-neurula stages, tested genomic regions, transcript models and conservation between P. mammillata and P. fumigata (from https://www.aniseed.cnrs.fr/ and Dardaillon et al., 2020; Madgwick et al., 2019). Representative examples of X-gal staining at tailbud stages following P. mammillata embryos electroporation of P. mammillata genomic regions for Klf1/2/4 (Phmamm.Klf1/2/4-A (same picture as Figure 5B) and Phmamm.Klf1/2/4-A3) and Nkxtun3 (Phmamm.Nkxtun3-A (same picture as Figure 5C), Phmamm.Nkxtun3-A1 and Phmamm.Nkxtun3-A3). Note that two separate VDML CRMs have been identified for Nkxtun3: a distal one, Phmamm.Nkxtun3-A1, and a proximal one, Phmamm.Nkxtun3-A3. This could be a case of redundant or shadow enhancers, but the distal CRM was preferentially active in posterior VDML while the proximal one did not show differential activity along the antero-posterior axis. Embryos are shown in lateral view with dorsal to the top and anterior to the left. Scale bar: 50 μm. Schematic representation of the various constructs and their activity at tailbud stages in VDML (blue) (n indicates the total number of embryos examined, N indicates the number of independent experiments).
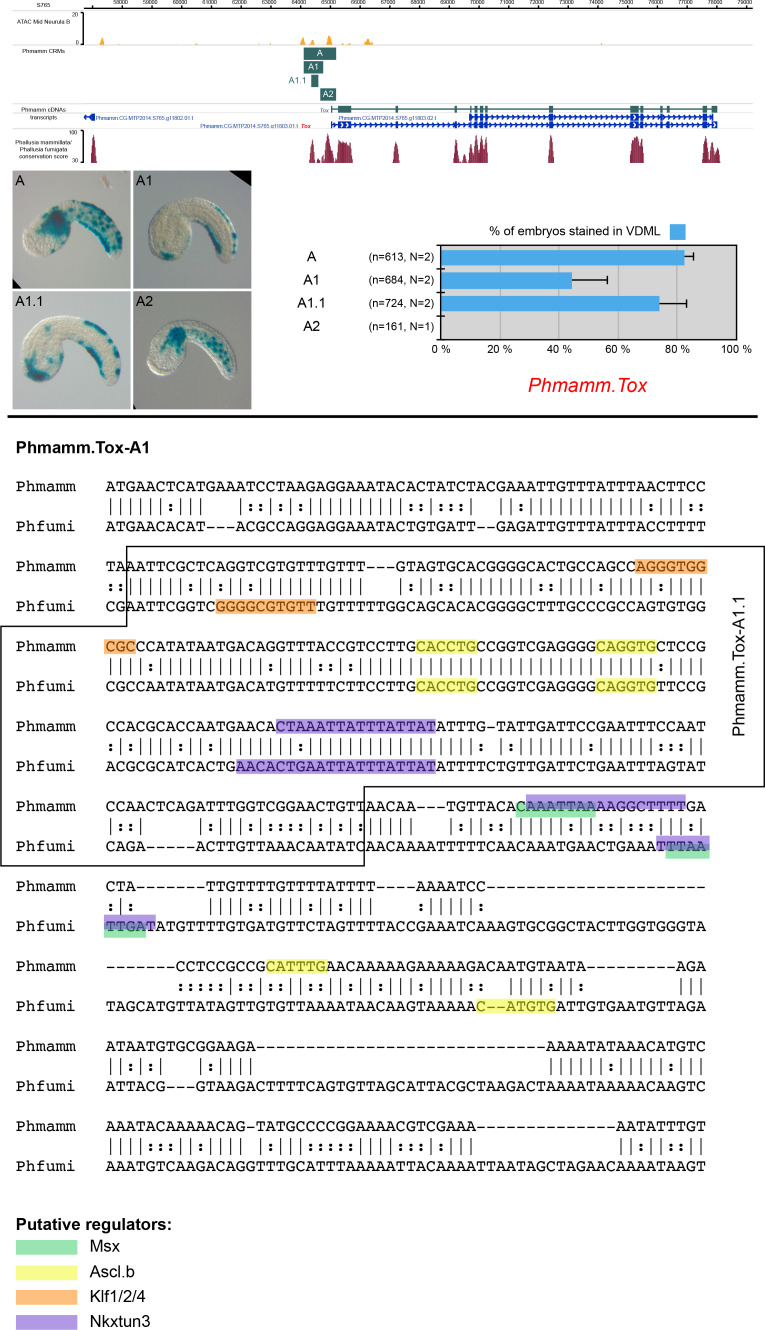
Figure 5—figure supplement 3. CRMs controlling Phmamm.Tox expression in VDML.

Figure 5—figure supplement 3.

(Top) Snapshot of the Phmamm.Tox locus depicting ATAC-seq profile at mid-neurula stages, tested genomic regions, transcript models and conservation between P. mammillata and P. fumigata (from https://www.aniseed.cnrs.fr/ and Dardaillon et al., 2020; Madgwick et al., 2019). Representative examples of X-gal staining at tailbud stages following P. mammillata embryos electroporation of P. mammillata genomic regions for Tox (Phmamm.Tox-A (same picture as Figure 5D), Phmamm.Tox-A1, Phmamm.Tox-A1.1 and Phmamm.Tox-A2). Phmamm.Tox-A (1093 bp) was the longest region tested for Phmamm-Tox, and it was found active in tail muscle in addition to VDML. Both activities could be separated into two sub-domains of Phmamm.Tox-A: Phmamm.Tox-A1 (VDML) and Phmamm.Tox-A2 (muscle). Embryos are shown in lateral view with dorsal to the top and anterior to the left. Scale bar: 50 μm. Schematic representation of the various constructs and their activity at tailbud stages in VDML (blue) (n indicates the total number of embryos examined, N indicates the number of independent experiments). (Bottom) Identification of putative TFBS for candidate upstream factors in Phmamm.Tox-A1 aligned with its counterpart from P. fumigata. All putative sites for Msx, Ascl.b, Klf1/2/4, and Nkxtun3 have been mapped, but only conserved sites are shown: 1 Msx, 3 Ascl.b, 1 Klf1/2/4, and 2 Nkxtun3 sites. Comparison with Ciinte.Tox-int1.2 (Figure 3—figure supplement 3) was suggestive of a shared regulation by Ascl.b. Note that the size of the highlighted site for of a given TF may vary depending on the matrix used.
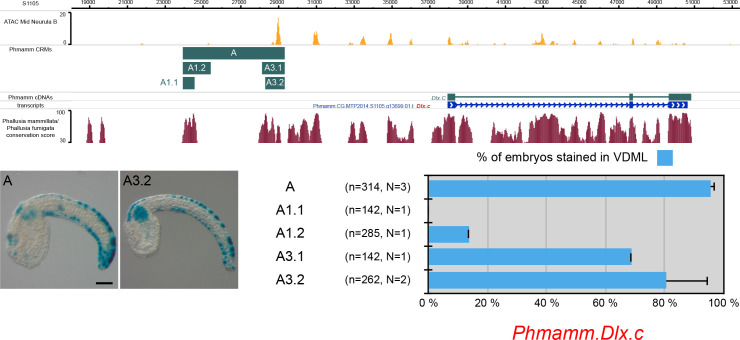
Figure 5—figure supplement 4. CRMs controlling Phmamm.Dlx.c expression in VDML.

Figure 5—figure supplement 4.

Snapshot of the Phmamm.Dlx.c locus depicting ATAC-seq profile at mid-neurula stages, tested genomic regions, transcript models and conservation between P. mammillata and P. fumigata (from https://www.aniseed.cnrs.fr/ and Dardaillon et al., 2020; Madgwick et al., 2019). Representative examples of X-gal staining at tailbud stages following P. mammillata embryos electroporation of P. mammillata genomic regions for Dlx.C (Phmamm.Dlx.c-A (same picture as Figure 5E), and Phmamm.Dlx.c-A3.2). Embryos are shown in lateral view with dorsal to the top and anterior to the left. Scale bar: 50 μm. Schematic representation of the various constructs and their activity at tailbud stages in VDML (blue) (n indicates the total number of embryos examined, N indicates the number of independent experiments).