. 2020 Nov 16;9:e59157. doi: 10.7554/eLife.59157

Figure 9. Divergence in gene regulation in Stolidobranchia ascidians.

(A–F) Activity of various CRMs from C. intestinalis and P. mammillata in the embryos of M. appendiculata. The name of the electroporated CRM is indicated on each picture. Details for each experiment can be found in Figure 9—figure supplement 1. (G–L) Activity of various genomic regions from H. roretzi in the embryos of M. appendiculata (G, I and K) and P. mammillata (H, J and L). Details for each experiment can be found in Figure 9—figure supplement 2. Embryos are shown in lateral view with dorsal to the top and anterior to the left. Scale bars: 100 μm.

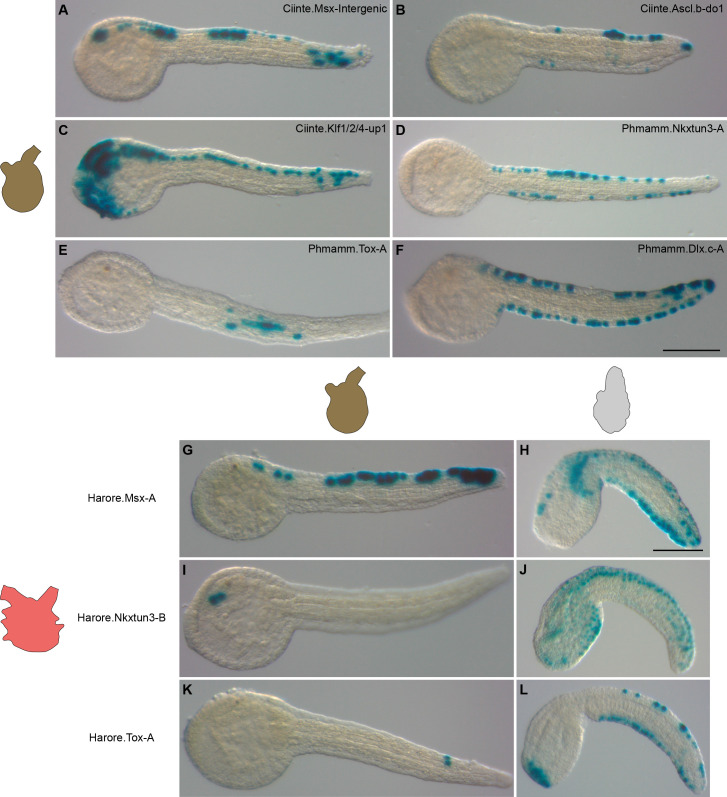
Figure 9.

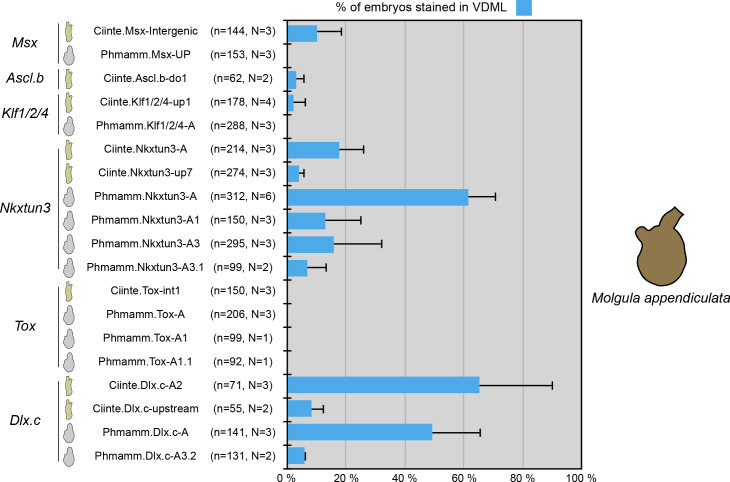
Figure 9—figure supplement 1. Activity of VDML CRMs from C. intestinalis and P. mammillata in the embryos of M. appendiculata.

Figure 9—figure supplement 1.

Schematic representation of the various constructs and their activity at tailbud stages in VDML (blue) (n indicates the total number of embryos examined, N indicates the number of independent experiments).
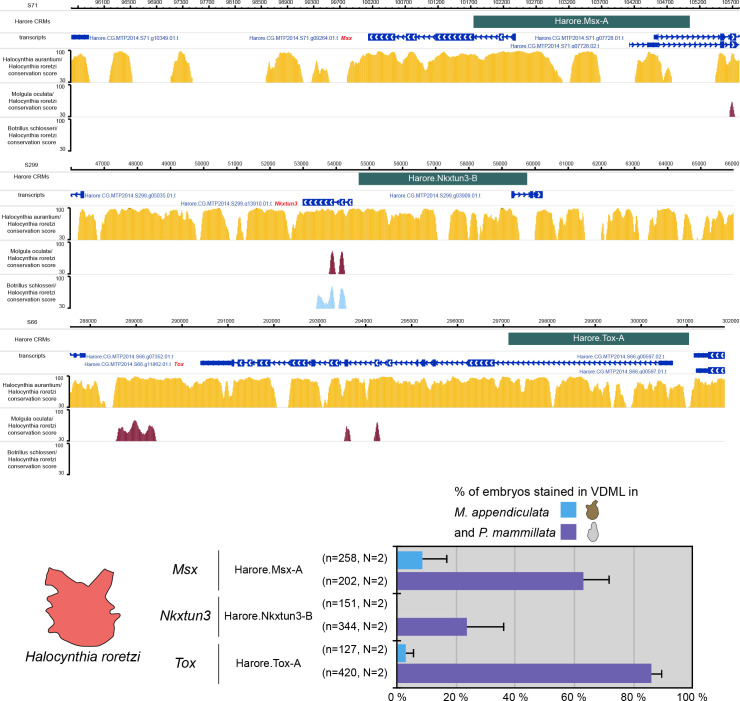
Figure 9—figure supplement 2. Activity of genomic regions from H. roretzi in the embryos of P. mammillata and M. appendiculata.

Figure 9—figure supplement 2.

Snapshots of the Harore.Msx, Harore.Nkxtun3 and Harore.Tox loci depicting tested genomic regions, transcript models and conservation between H. roretzi and H. aurantium, M. oculata and Botryllus schlosseri (from https://www.aniseed.cnrs.fr/ and Dardaillon et al., 2020; Madgwick et al., 2019). Schematic representation of the various constructs and their activity at tailbud stages in VDML (blue) (n indicates the total number of embryos examined, N indicates the number of independent experiments).