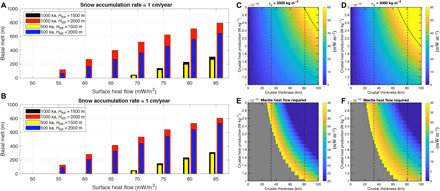
Fig. 2. Heat flow required for basal melting and the crustal heat flow budget during the Noachian.

(A and B) Basal melt expected as a function of the geothermal heat flux for a variety of ice accumulation rates and total thickness of the ice sheet. ka, thousand years. Two-dimensional density plots (C and D) show crustal heat flow as a function of the crustal heat production rate and crustal thickness for crustal densities of 2500 and 3000 kg m−3. The black contour shows the isochron for a heat flux of 60 mW m−2. As expected, only thick crust with a high heat production rate could generate surface heat flow that exceeds 60 mW m−2. (E and F) Mantle heat flow contribution required for surface heat flow to exceed 60 mW m−2 during the Noachian for regions in (A) and (B) where the crustal heat flow was less than 60. Areas in gray are for situations where mantle heat flow above 40 mW m−2 is required for the surface heat flow to exceed 60 mW m−2.
