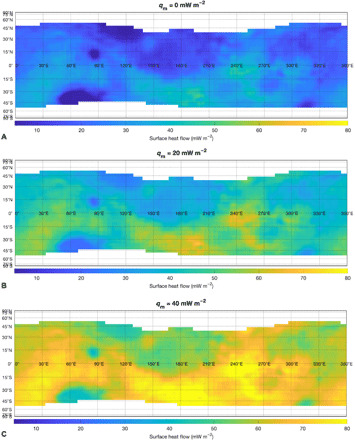
Fig. 3. Surface heat flow estimates for Noachian Mars.

(A) Crustal heat flow based on GRS chemical maps (fig. S2) and crustal thickness map of Mars (fig. S3) during the Noachian. (B and C) Surface heat flow arising from the combined crustal (A) and laterally constant mantle (denoted as qm) contributions. An H mask has been applied to exclude areas with high H content.
