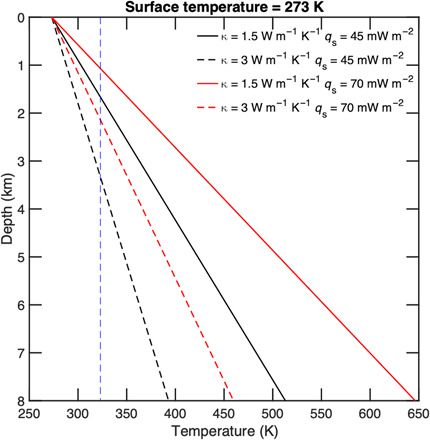
Fig. 5. Crustal conductive geotherm for a variety of heat flow estimates (qs) and thermal conductivity of the crust (k).

The vertical blue line denotes temperature value of 50°C (323 K), past which hydrothermal alterations can occur.

The vertical blue line denotes temperature value of 50°C (323 K), past which hydrothermal alterations can occur.