
Fig. 1. Schematic of one of three independent replicates of the selection experiment.
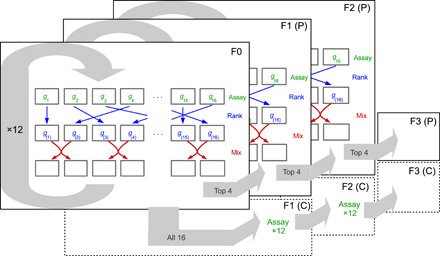
Each layer represents a generation of females. Arrows within a layer illustrate the sorting procedure where we identified fish that formed the most polarized groups. To do this, groups were first assayed for their group polarization. Here, variables g1 to g16 denote the 16 groups’ polarization scores in round t. These scores were subsequently ranked (blue arrows) with g(1) to g(16), denoting the ranked scores from lowest to highest. Following this, half of the group members were mixed with adjacently ranked groups (red arrows). This ranking and sorting procedure was repeated 12 times (circular gray arrow) before 26 fish from the top four ranked groups were bred for the polarization lines, and 26 fish from remaining 16 groups were bred for the control lines. This sorting procedure was repeated three times for the polarization lines (indicated by the layers), whereas fish from the control group experienced the same assaying and sorting, except that fish from these control lines were not ranked.