
Fig. 2. Polarization and nearest neighbor distance in groups of guppies artificially selected for polarization.
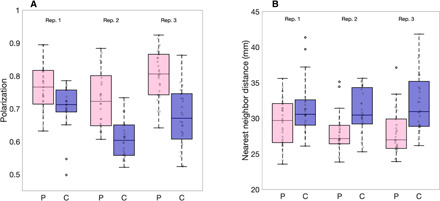
Boxplots of (A) median polarization and (B) median nearest neighbor distance for groups of eight females in polarization selected (pink boxed) or control lines (blue boxes). Replicate lines 1, 2, and 3 are denoted above the boxes. Gray markers show individual data points (i.e., trials). Horizontal lines indicate medians, boxes indicate the interquartile range, and whiskers indicate all points within 1.5 times the interquartile range. N(Replicate 1,2,3) = 60, 56, and 57.