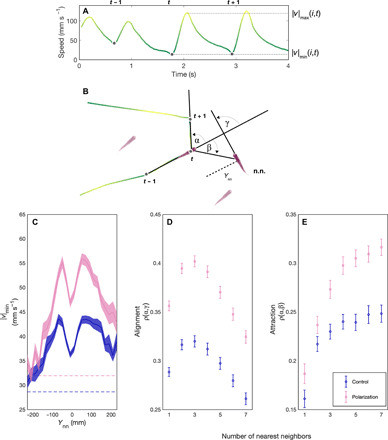
Fig. 3. Burst and glide analysis and inferring social interactions of guppies artificially selected for polarization.

(A) Time series containing three consecutive speed minima (dots) followed by bursting events. (B) The corresponding trajectory for fish i (in the center). The positions at the preceding and following speed minima are used to calculate the turning angle α of fish i at time t. In this example, the turn has the same sign as the nearest neighbor orientation (i.e., alignment) γ and the opposite sign to the attraction angle β. (C to E) The social interactions of females in the control lines (blue) and polarization selection lines (pink) in response to nearest neighbors. (C) The mean speed minimum when the nearest neighbor (n.n.) is in front (+) or behind (−) by a distance Ynn. The error region shows the SEM over trials. Dashed lines show the overall mean speed minimum for control and polarization lines in individual open-arena trials. (D) Alignment and (E) attraction responses to the geometric center of k nearest neighbors, where k ranges from 1 (nearest neighbor) to 7 (all conspecifics). The Spearman correlations ρ were computed for each k and for each trial for all β and γ with absolute values of less than 90°. The set of β was additionally restricted to time points where the k neighbors were all less than 200 mm from the focal fish (see the Supplementary Materials). Means (symbols) and SE (bars) were calculated for each selection line from these correlation coefficients.
