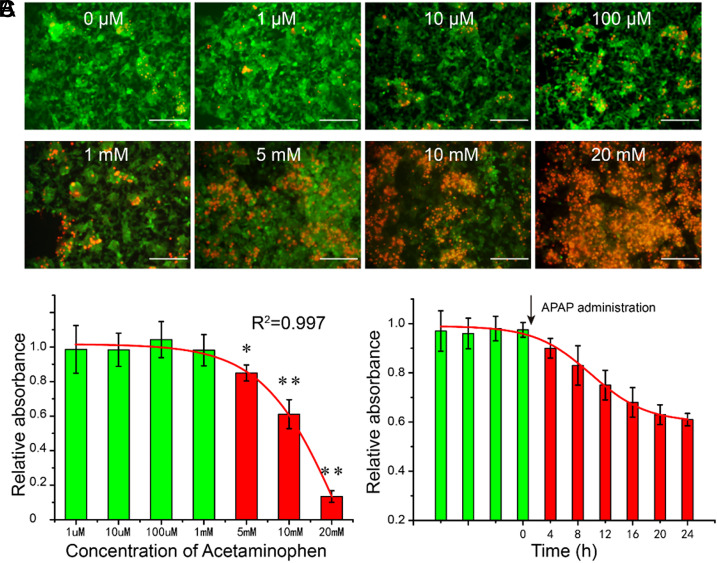
FIG. 5.
Dose- and time-dependent hepatotoxicity of APAP. (a) Representative images of the cells in the central channel stimulated by different concentrations of APAP with live/death staining. Scale bar = 200 μm. (b) Dose-dependent hepatotoxicity of APAP on day 3. (c) Time-dependent hepatotoxicity of APAP at the concentration of 10 mM.

