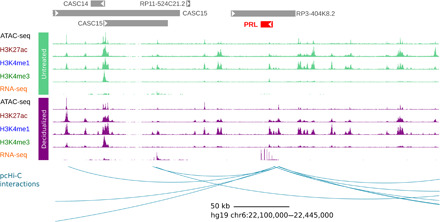
Fig. 1. Schematic of RNA-seq, ATAC-seq, ChIP-seq, and pcHi-C maps centered on the prolactin (PRL) gene, as an example.

Each histone modification and RNA-seq track shows read counts per base pair for each experiment. The pcHi-C signal track shows the number of reads per MboI restriction fragment. Arcs in the pcHi-C interactions track show significant interactions between the promoter of the PRL gene and putative distal regulatory elements identified with pcHi-C. Pooled data (three replicates) for one cell line are shown for untreated cells (MSCs, in green) and decidualized cells (DSCs, in purple). pcHi-C data were generated in a fourth cell line that was decidualized.
