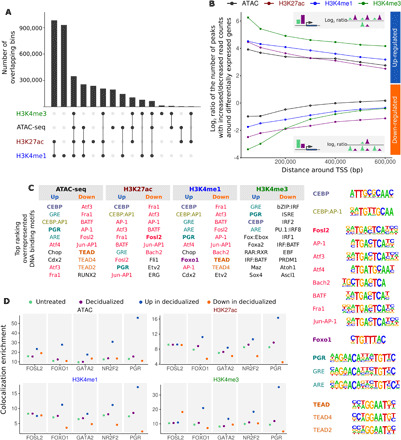
Fig. 2. Differential histone modification and ATAC-seq peaks are associated with differential expression and enriched for transcription factors with roles in decidualization.

(A) Plot showing the overlap between the different histone modifications and ATAC-seq maps (intersection between annotations). Peaks were assigned to 100-bp bins to avoid ambiguity in overlap due to different peak borders. Black circles indicate overlap with other annotations; light gray circles indicate that the annotation does not overlap others. (B) Each data point shows the ratio between the number of increased/decreased differential peaks nearby genes that increase expression after decidualization (blue, positive log ratios; upper half of the figure) or decrease expression after decidualization (orange, negative log ratios; lower half of the figure). Genes that were more highly expressed in decidualized cells were flanked by a higher number of ChIP-seq and ATAC-seq peaks that displayed increased read counts in decidualized samples compared to peaks that displayed decreased read counts (top inset). Genes that were down-regulated in decidualized cells showed the opposite trend (bottom inset). All enrichments: P < 10−25. (C) DNA binding motifs of transcription factors relevant in decidualization are enriched in peaks that change following decidualization treatment. Motifs are color-coded by similarity. (D) Colocalization of PGR, FOSL2, FOXO1, GATA2, and NR2F2 with ATAC-seq and ChIP-seq peaks. Transcription factor binding sites co-occur with ATAC-seq and ChIP-seq peaks in both untreated (green) and decidualized (purple) cells more often than with random peaks. Enrichment of the co-occurrences of PGR, FOXO1, GATA2, and NR2F2 are higher when co-occurring with peaks that have increased read counts (navy blue) and lower with peaks that have decreased read counts (orange) in decidualized compared to untreated cells. Enrichment of co-occurrences with peak sets was calculated as the fold difference between the number of transcription factor peaks overlapping with ATAC-seq/ChIP-seq peaks and with a random set of peaks (see Materials and Methods).
