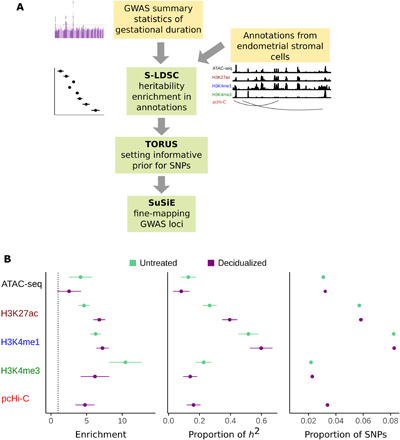
Fig. 4. GWAS analysis pipeline and heritability enrichment in functional annotations.

(A) Computational pipeline for analyzing GWAS of gestation duration. Yellow boxes (input data): GWAS summary statistics and functional annotations from endometrial stromal cells (in both untreated and decidualized cells). Green boxes: Stages of statistical analysis (see Materials and Methods). (B) Stratified LDSC heritability analysis of GWAS of gestational duration using functional annotations. Left: Fold enrichment of heritability in each annotation. Dashed line shows values at 1, i.e., no enrichment. Center: Proportion of heritability explained by each annotation. Right: Proportion of SNPs across the genome that fall within an annotation. For each annotation, enrichment (left) is the ratio of h2 proportion (center) divided by the SNP proportion (right). Error bars represent 95% confidence intervals.
