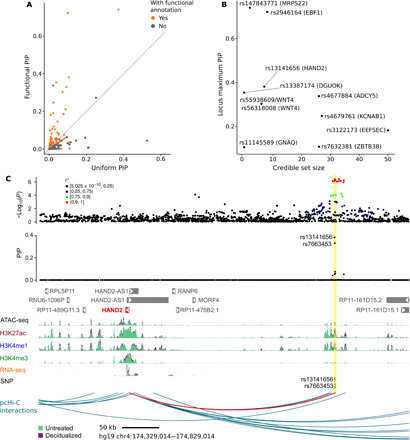
Fig. 5. Fine-mapping GWAS loci of gestational duration.

(A) PIPs of SNPs using uniform vs. functional priors in SuSiE (each dot is an SNP). The functional prior of an SNP is based on SNP annotations and is estimated using TORUS. (B) Summary of fine-mapping statistics of all 10 regions. X axis: The size (number of SNPs) of credible set. Y axis: The maximum PIP in a region. We label each region by its top SNP (by PIP) and the likely causal gene, according to Table 1 or the nearest gene of the top SNP. (C) Likely causal variants near HAND2 and their functional annotations. The top panel shows the significance of SNP association in the GWAS and the middle panel shows fine-mapping results (PIPs) in the region. The vertical yellow bar highlights the two SNPs with high PIPs. These SNPs are located in a region annotated with ATAC-seq, H3K27ac, H3K4me1, and H3K4me3 peaks (bottom). This putative enhancer also had increased ATAC-seq, H3K27ac, and H3K4me1 levels in decidualized samples and interacts with the HAND2 promoter (red arc).
