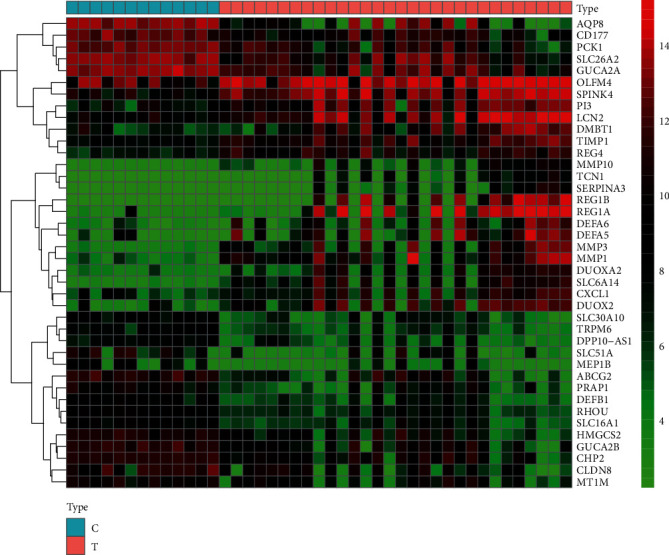
Figure 2.

Gene heat map. In the gene heat map, red and green represent upregulated (logFC > 0) and downregulated (logFC < 0) genes in the sample, respectively, whereas black represents no significant difference. The first 13 samples were from healthy people, and the last 30 samples were from patients with ulcerative colitis.
