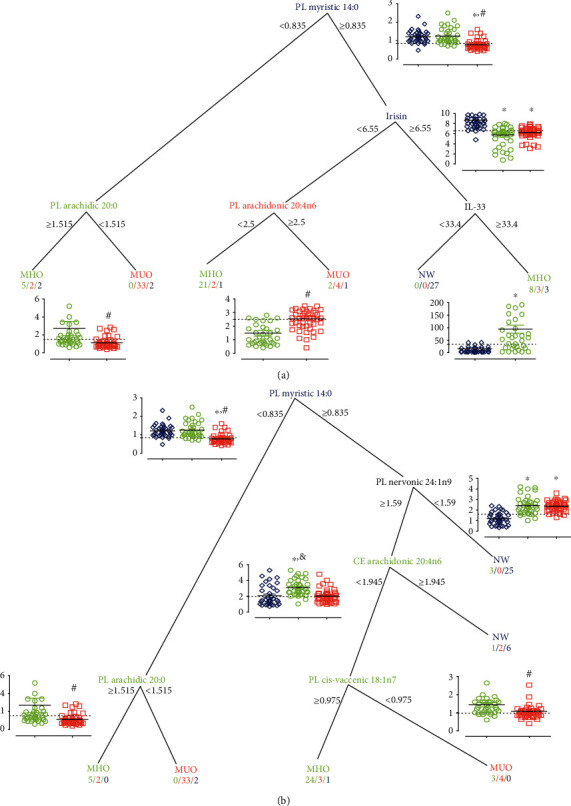
Figure 4.

Decision tree analysis relating clinical groups (NW, MHO, and MUO). (a) Considering fatty acids, irisin, and cytokines concentration or (b) only fatty acids. The variable name, frequency, and cut-off values are shown. Inset plots showed the sample distribution of the corresponding variable and were cropped to highlight the media in each group. The numbers bellow group shows the “n”—number of children for MHO/MUO/NW. Statistical difference vs. NW are represented with ∗; with respect to MHO as #, and with MUO as &. CE: cholesteryl ester; MHO: metabolically healthy obesity; MUO: metabolically unhealthy obesity; NW: normal weight; PL: phospholipid.
