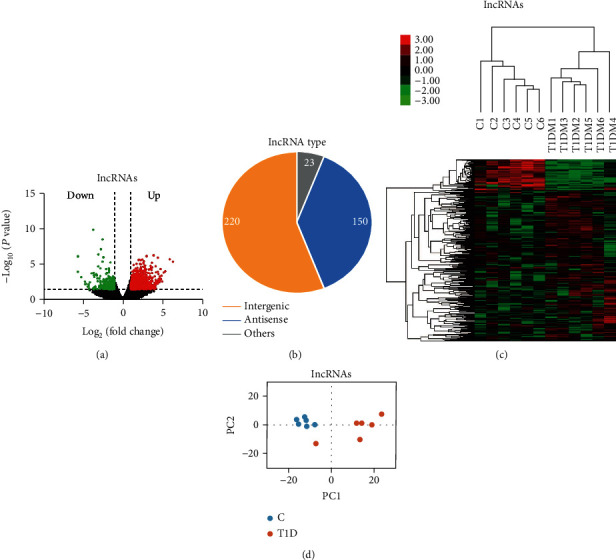
Figure 2.

Features of novel lncRNAs in T1D patients as compared with those in healthy controls. (a) Differentially expressed lncRNAs (T1D-lncRNAs) were identified from a volcano plot showing data from T1D patients relative to healthy controls. The vertical black lines correspond to twofold up- and downregulation, respectively, and the horizontal black line represents a p value of 0.05. The red and green points in the plots represent the differentially expressed transcripts in T1D patients with statistical significance for upregulation (324 lncRNAs) and downregulation (69 lncRNAs), respectively. (b) Pie chart representations show the proportion of T1D patients associated with lncRNAs that are transcribed as antisense (blue), intergenic (orange), or other types (grey) and analyzed postoptimization. (c) Differential lncRNA expression profiles were hierarchically cluster analyzed and shown as a heat map, wherein 393 lncRNAs were upregulated (red) or downregulated (green). (d) Principal component analysis results.
