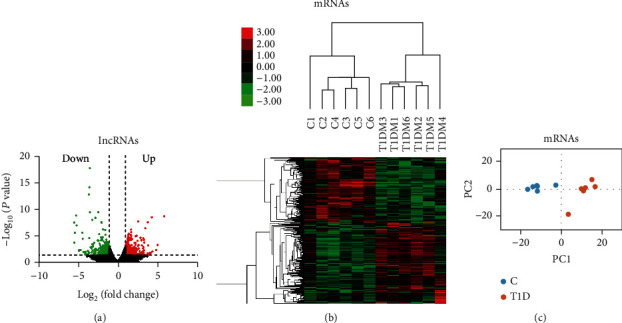
Figure 3.

Transcriptomic landscape of T1D-mRNAs. (a) T1D differentially expressed mRNAs (T1D-mRNAs) were identified from the volcano plot in T1D patients relative to normal controls. The vertical black lines correspond to twofold up- and downregulation, respectively, and the horizontal black line represents a p value of 0.05. The red and green points in the plots represent differentially expressed transcripts with statistical significance for upregulation (172 mRNAs) and downregulation (139 mRNAs), respectively. (b) Differential mRNA expression profiles were hierarchically cluster analyzed and shown as heat maps, wherein upregulated genes are depicted in red and downregulated genes are depicted in green. (c) Principal component analysis also showed that mRNAs are distinguishable between T1D patients and controls.
