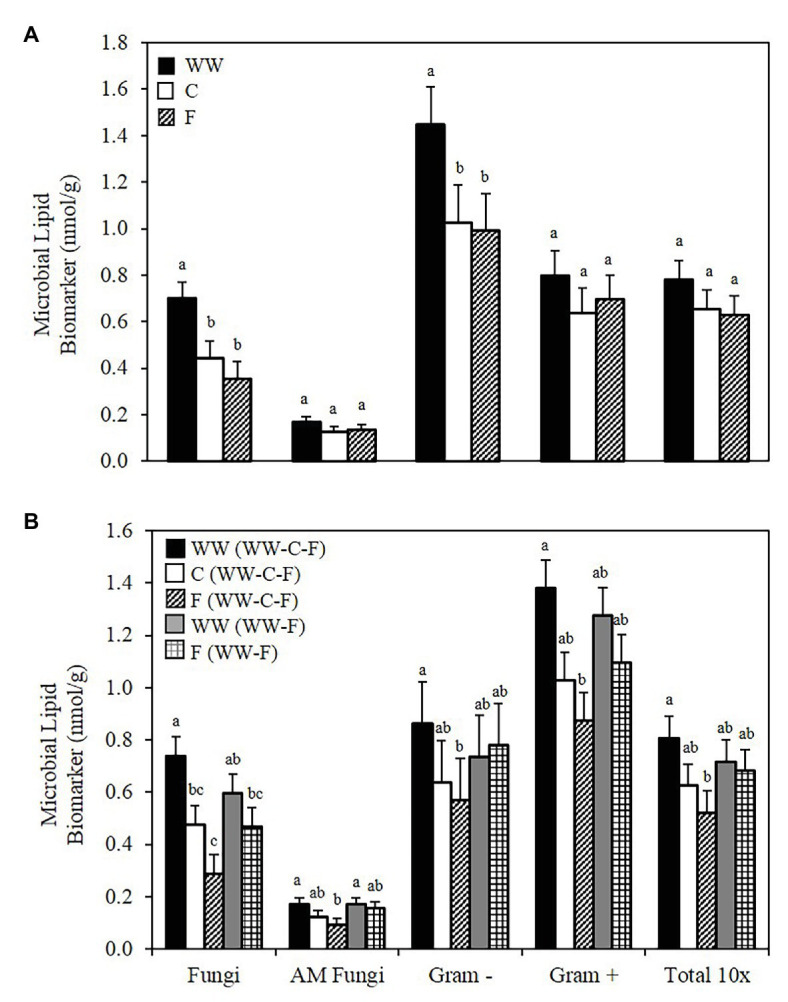
Figure 2.

Soil microbial lipid abundance. Biomarker groups and total PLFA (T-PLFA) concentrations (nmol/g) of soil. Values are least square means across crop years 2010–2012. (A) Shows the average across both WW-C-F and WW-F rotation systems. (B) Shows the average for each crop of the separate rotation systems. Error bars indicate standard error. Values within each biomarker group with different letters are significantly different (p ≤ 0.05). WW, winter wheat; C, camelina; F, fallow.
