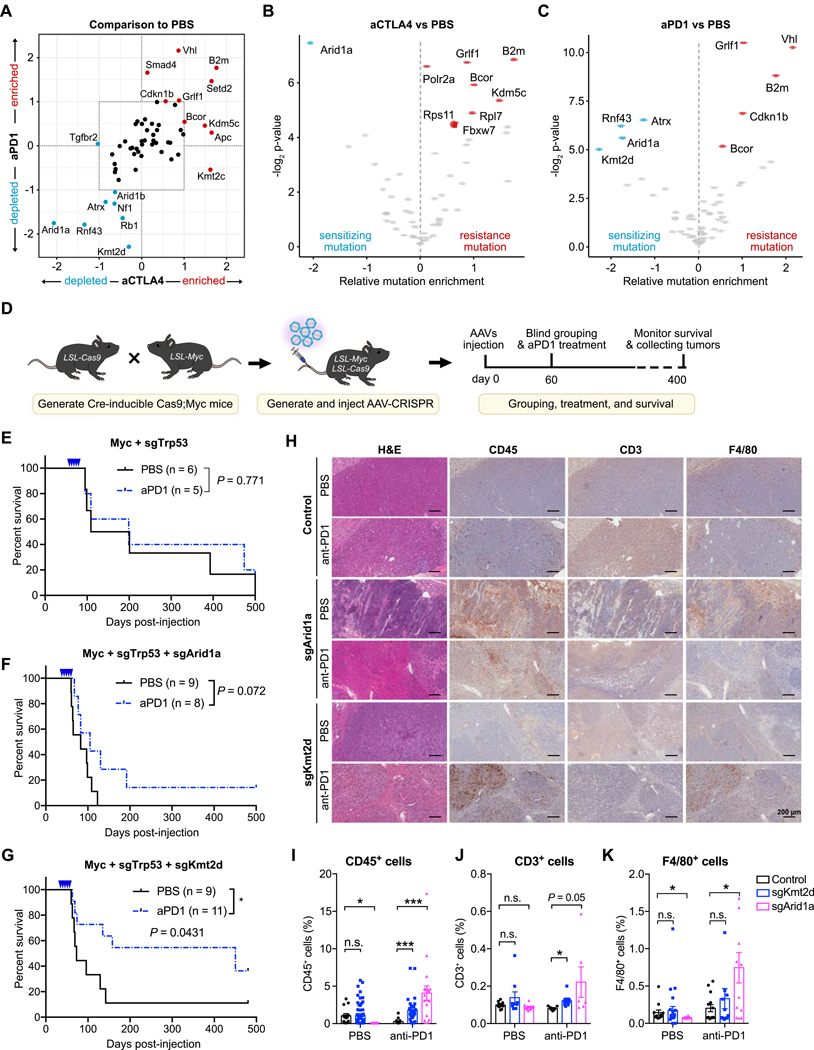
Figure 2. Identification and validation of genetic factors that modulate response to checkpoint immunotherapy.
(A) Scatter plot of average mutation enrichment scores across aCTLA4 or aPD1 treated samples, subtracted by the average score in PBS samples. Negative values indicate relative depletion, while positive values indicate relative enrichment.
(B) Volcano plot comparing the mutation enrichment scores in aCTLA4 vs. PBS treated samples. Negative mutation enrichment scores indicate gene mutations that confer sensitivity to aCTLA4 treatment upon CRISPR mutagenesis, while positive scores indicate gene mutations that confer resistance.
(C) Volcano plot comparing the mutation enrichment scores in aPD1 vs. PBS treated samples. Negative mutation enrichment scores indicate gene mutations that confer sensitivity to aPD1 treatment upon CRISPR mutagenesis, while positive scores indicate gene mutations that confer resistance.
(D) Schematic of experimental design for single gene validation experiments. AAV-CRISPR vectors with a liver-specific Cre expression cassette were intravenously injected into LSL-Cas9; LSL-Myc mice to induce Myc overexpression and Cas9 expression for sgRNA-mediated mutagenesis. Mice were subsequently treated with PBS or aPD1.
(E) Kaplan-Meier survival curves of mice bearing liver tumors with Myc overexpression and Trp53 knockout. PBS (n = 6) and aPD1 (n = 5) treated mice showed no significant survival difference (P = 0.581).
(F) Kaplan-Meier survival curves of mice bearing liver tumors with Myc overexpression, Trp53 knockout, and Arid1a knockout. PBS (n = 9) and aPD1 (n = 8) treated mice showed no significant survival difference (P = 0.072).
(G) Kaplan-Meier survival curves of mice bearing liver tumors with Myc overexpression, Trp53 knockout, and Kmt2d knockout. PBS (n = 9) and aPD1 (n = 11) treated mice showed a significant survival difference (P = 0.0231).
(H) Representative images of H&E, CD45, CD3, and F4/80 staining of liver sections from Myc+sgTrp53, Myc+sgTrp53+sgArid1a, Myc+sgTrp53+sgKmt2d tumors with or without anti-PD1 treatment. Scale bar is 200 μm.
(I-K) Quantification of (I) CD45+ immune cells, (J) CD3+ T cells, or (K) F4/80+ macrophages in liver sections from control, Kmt2d-mutant, or Arid1a-mutant tumors, with or without anti-PD1 treatment. (I) CD45+ cells in different groups. Two-tailed unpaired t-test, CD45+ cells in PBS group: sgKmt2d (n = 57) vs. control (n = 14), P = 0.8672; sgArid1a (n = 16) vs. control (n = 57), P = 0.0012. CD45+ cells in anti-PD1 group: sgKmt2d (n = 31) vs. control (n = 17), P = 0.0008; sgArid1a (n = 18) vs. control (n = 17), P = 0.0005. (J) CD3+ cells in different groups T-test, CD3+ T cells in PBS group: sgKmt2d (n = 9) vs. control (n = 10), P = 0.1988; sgArid1a (n = 11) vs. control (n = 10), P = 0.1373. CD3+ T cells in anti-PD1 group: sgKmt2d (n = 8) vs. control (n = 9), P = 0.0026; sgArid1a (n = 6) vs. control (n = 9), P = 0.050. (K) F4/80+ cells in different groups. T-test, F4/80+ cells in PBS group: sgKmt2d (n = 25) vs. control (n = 12), P = 0.708; sgArid1a (n = 14) vs. control (n = 12), P = 0.0454. CD3+ T cells in anti-PD1 group: sgKmt2d (n = 16) vs. control (n = 14), P = 0.4038; sgArid1a (n = 12) vs. control (n = 14), P = 0.0104. (N represents different IHC staining regions of the slides collected from ≥ 2 mice per treatment group)
Error bars: All data points in this figure are presented as mean ± SEM. Asterisks: * P < 0.05, ** P < 0.01, *** P < 0.001.
See also: Supplementary Fig. S1

