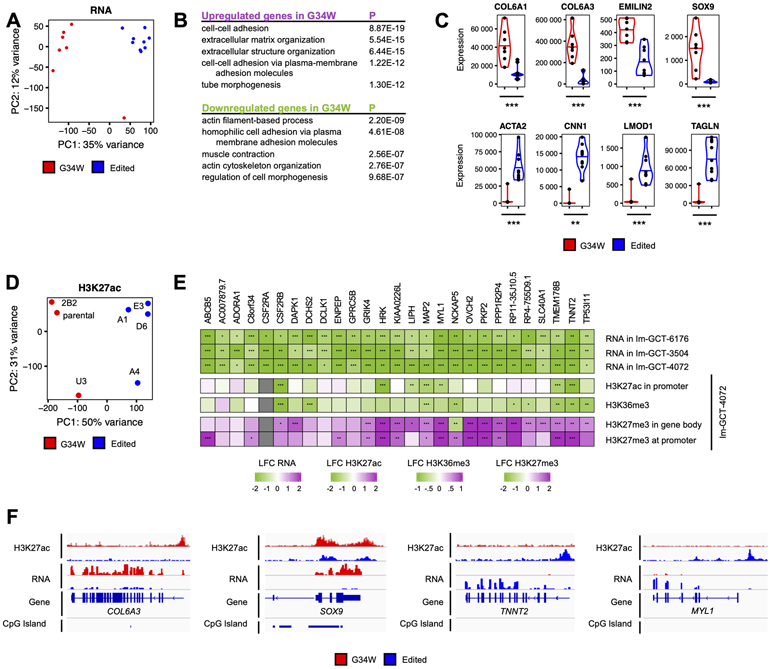
Figure 2. G34W promotes ECM remodeling and impairs muscle contraction pathways.

(A) PCA reveals distinct transcriptomic profiles between Im-GCT-4072 G34W (red; n=7) and edited lines (blue; n=9). Read counts were counted over Ensembl genes, normalized using the median-of-ratios procedure and transformed using the variance-stabilizing transformation. The effect of the genotype is captured in PC1 (35% of the variance).
(B) Pathway enrichment analysis of statistically significantly up- (purple) and downregulated (green) genes in G34W compared to edited lines from Im-GCT-4072. Pathway enrichment analysis was performed using g:Profiler. Top 5 statistically significantly enriched terms (GO:BP, term size<1000, P<0.05) are shown. The complete table can be found in Table S3.
(C) Violin plots depicting expression levels of extracellular matrix genes COL6A1, COL6A3, EMILIN2 and SOX9 as well as muscle contraction ACTA2, CNN1, LMOD1 and TAGLN in G34W (red) and edited (blue) lines from Im-GCT-4072. *: P<0.05, **: P<0.01, ***: P<0.001, n.s.: non-significant. Gene expression levels reported in median-of-ratios normalized read counts. Significance was assessed using DESeq2. The complete table can be found in Table S2.
(D) PCA reveals distinct H3K27ac profiles between G34W (red; n=3) and edited lines (blue; n=4) from Im-GCT-4072. Read counts were counted over 10kb genomic bins and normalized to RPKM. The effect of the genotype is captured in PC1 (50% of the variance). The labels correspond to clones. Refer to Table S1 for more details on clones.
(E) Heatmap illustrating transcriptional and epigenetic changes (H3K27ac, H3K36me3, H3K27me3) at consistently transcriptionally deregulated genes across the three isogenic cell models. Differential gene expression and histone mark enrichment are reported in log2 fold-change (LFC) in G34W lines over edited lines of the respective isogenic cell models. Significance was assessed using DESeq2. *: P<0.05, **: P<0.01, ***: P<0.001. The complete table can be found in Table S2.
(F) Genomic tracks highlighting changes in H3K27ac and gene expression at COL6A3, SOX9, TNNT2 and MYL1 loci between G34W (red) and edited (blue) lines from Im-GCT-4072. Signals overlaid by replicates, reported in RPKM, and group auto-scaled by genomic assay.
