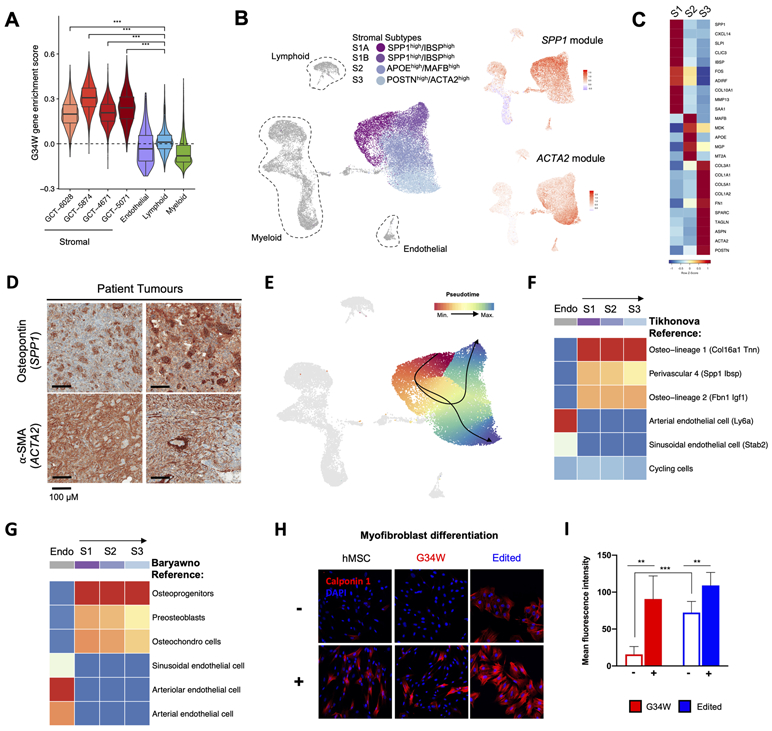
Figure 5. GCT stromal cells resemble specific osteoprogenitors and a distinct ACTA2+ subset have features of contractile cells.

(A) Boxplot displaying higher G34W enrichment scores for single cells in stromal clusters from each patient. The G34W enrichment score is derived from the average expression of differentially expressed genes (LFC>2) between isogenic G34W and edited Im-GCT-4072 lines. ***: P<0.0005, significance was assessed using a Wilcoxon rank sum test.
(B) Left: UMAP plot of Harmony integrated cells from scRNA-seq on n=4 primary GCTs, revealing the 4 stromal subtypes S1A, S1B, S2, and S3.
Right: Average expression of genes highly correlated with S1-specific SPP1 gene (SPP1 module), or with S3-specific ACTA2 gene (ACTA2 module), shown on UMAP plot of Harmony integrated cell clusters. Refer to Table S1 for details.
(C) Row-scaled heatmap showing average expression of differentially expressed genes that characterize each stromal subtype.
(D) Representative IHC for osteopontin (SPP1) and alpha-SMA (ACTA2) in two GCT patient tumours.
(E) Lineage inference by Slingshot showing neoplastic trajectories from S1A to S1B, and S1A to S3. Cells are coloured by pseudotime, with red cells occurring earlier than blue cells in the trajectory.
(F) SingleR classification of each stromal cell subtype (S1, S2, S3) and endothelial control based on Tikhonova et al. reference cell types (28). Stromal cell subtypes most strongly resemble the Osteo-lineage 1 reference cell cluster (labelled as O1 (Col16a1 Tnn) in Tikhonova et al.).
(G) SingleR classification of each stromal cell subtype (S1, S2, S3) and endothelial control based on Baryawno et al. reference cell types (27). Stromal cell subtypes most strongly resemble the osteoprogenitors reference cell cluster (labelled as OLC-2 subtype 8_3 in Baryawno et al.).
(H) Representative immunofluorescence images for the myofibroblast muscle marker calponin 1 in hMSCs and isogenic Im-GCT-4072 cells maintained in non-induced (−) or myofibroblast differentiation media (+) for 2 weeks.
(I) Bar-plot quantifying the mean fluorescence intensity of calponin 1 staining in G34W (n=2 lines; three different fields each) and edited lines (n=2; four different fields each) maintained in non-induced (−) or myofibroblast differentiation media (+).
