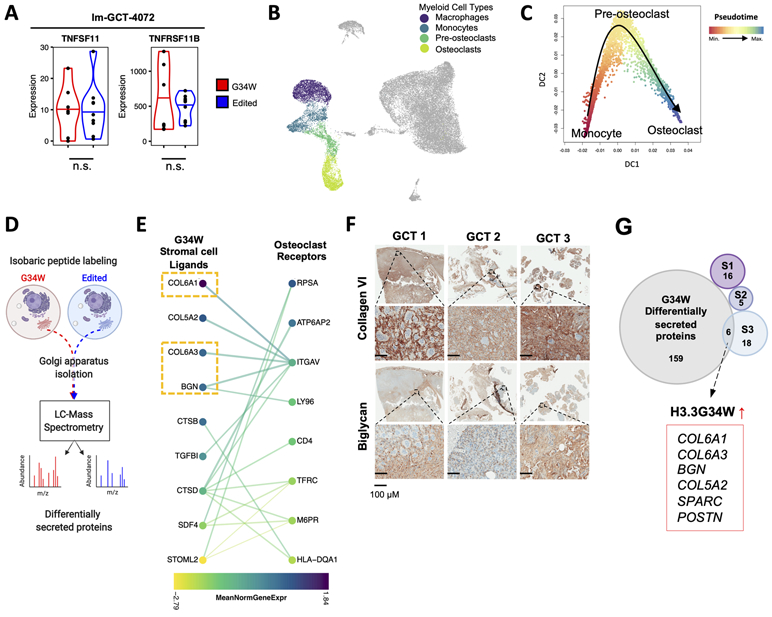
Figure 6. G34W GCT stromal cells secrete factors that promote ECM remodeling and association with myeloid cells.

(A) Violin plots depicting expression levels of TNFSF11 (RANKL) and TNFRSF11B (OPG) in G34W (red) and edited (blue) lines from Im-GCT-4072. *: P<0.05, ***: P<0.001, n.s.: non-significant. Gene expression levels reported in median-of-ratios normalized read counts Significance assessed using DESeq2.
(B) UMAP plot highlighting the myeloid compartment of GCT.
(C) Diffusion map showing a trajectory from monocytes (red) to terminally-differentiated osteoclasts (blue) through a pre-osteoclast intermediate along Slingshot-inferred pseudotime.
(D) Schematic of Golgi apparatus isolation and mass spectrometry workflow to identify differentially secreted proteins between isogenic G34W (red) and edited (blue) cells.
(E) CCInx-predicted (31) ligand-receptor interactions between GCT stromal cells (left) and osteoclast cells (right). Colors represent the mean normalized gene expression in each cell type. Only interactions between proteins differentially secreted in G34W cell lines by MS (P<0.05) and expressed by stromal cells are shown on the left and only genes differentially expressed (P<0.05) in osteoclasts (vs. non-myeloid cells) are shown on the right. P values were adjusted for multiple testing using FDR.
(F) Representative IHC for collagen type VI and biglycan in three patient GCTs.
(G) Venn diagram showing overlap of genes with significantly enriched expression in each stromal cell subtype, S1-S3 (Seurat Wilcox test, P<0.05, FDR corrected) and genes with significantly increased protein secretion in G34W cell lines by MS (P<0.05, FDR corrected). The 6 intersecting genes are highlighted.
