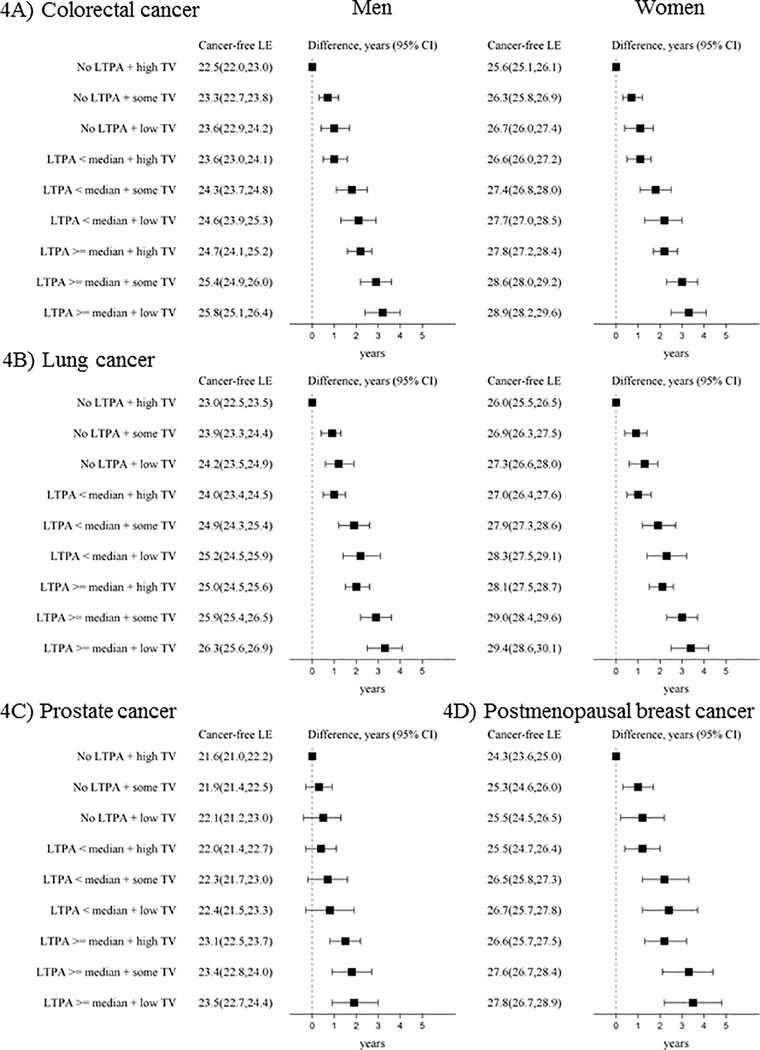
Figure 4. Life expectancy (years, 95% CI) cancer-free from A) colorectal cancer, B) lung cancer, C) prostate cancer, and D) postmenopausal breast cancer and life expectancy differences at age 50 by LTPA and TV viewing among ARIC participants (1987–2012).
LTPA categories included none, < median (0.1 - < 13.2 MET-h/week), and ≥ median (13.2+ MET-h/week). TV categories included high TV (viewing often/very often), some TV (sometimes viewing), and low TV (seldom/never viewing TV). Models were specified separately for each type of cancer (colorectal cancer and lung cancer models N=14,508, prostate cancer models N=6582, and postmenopausal breast cancer models N=7849). Models were adjusted for age, gender, race by ARIC center, education, smoking status, and alcohol intake. Prostate and breast models did not include gender. Abbreviations: CI = confidence interval, CRC= colorectal cancer, LE= life expectancy, LTPA=leisure-time moderate-to-vigorous physical activity, MET= metabolic equivalent of task, TV=television.

