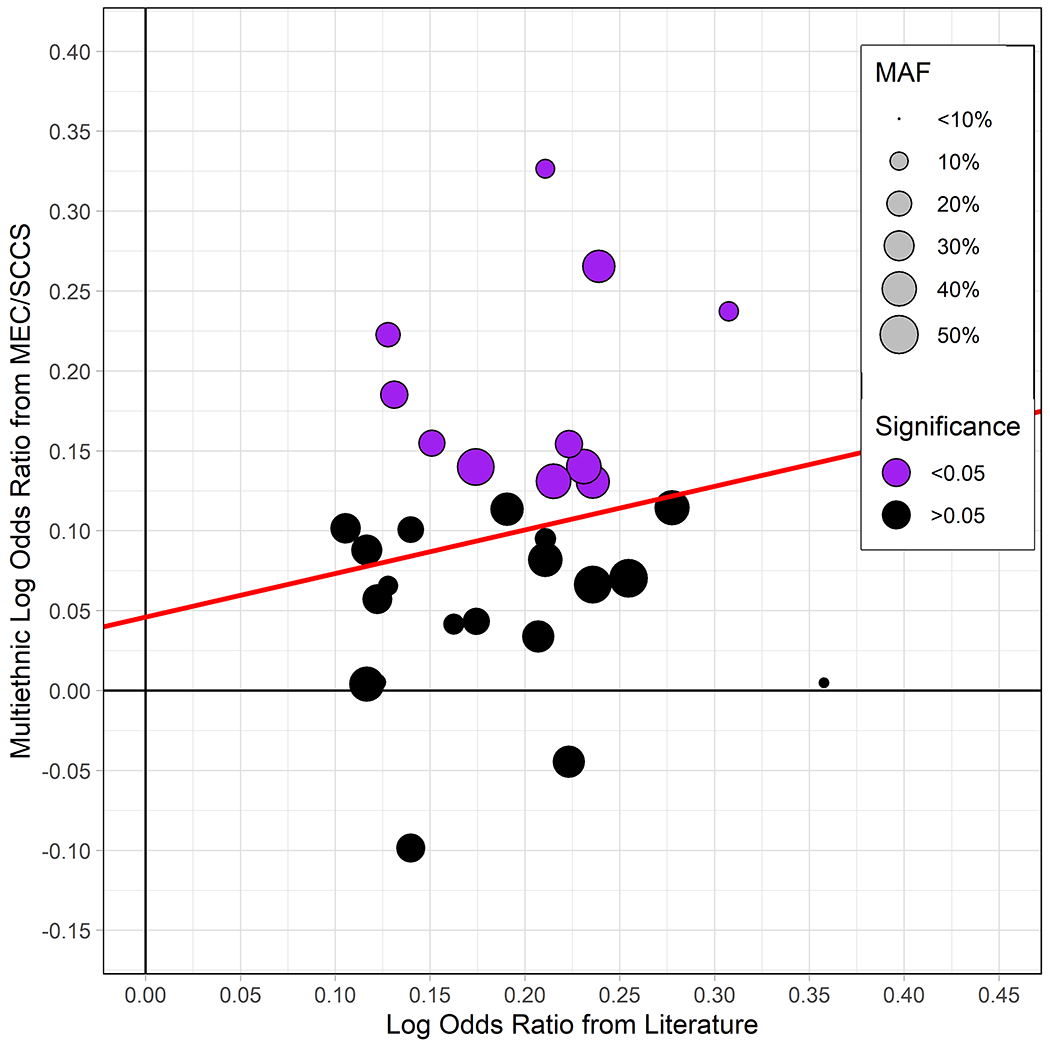
Figure 2.

Comparison between 31 replicating SNPs from multiethnic replication analysis and most recent GWAS results on the log OR scale. Point size corresponds to minor allele frequency (MAF) among controls in the replication analysis. The red line represents, MAF-weighted least squares fit. One point removed from figure due to extreme replication result (rs2816938, OR = 0.69). MEC = Multiethnic Cohort; SCCS = Southern Community Cohort Study.
