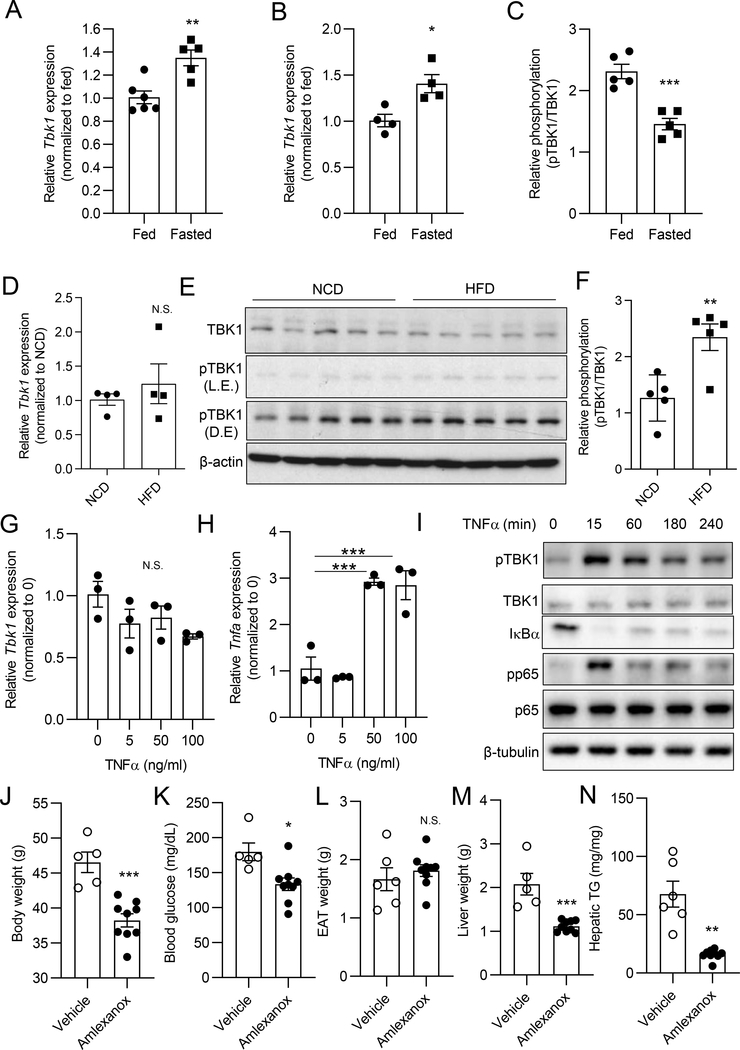
Figure 1. Hepatic TBK1 mRNA expression is induced by fasting and its activity increases upon HFD.
(A) Tbk1 expression in liver tissues from ad libitum-fed or 16 h fasted mice. n = 5–6 mice per group. (B) Tbk1 expression in primary hepatocytes from ad libitum-fed or 16 h fasted mice. n = 4 mice per group. (C) Quantified amount of pTBK1 (Ser172) and TBK1 in liver tissues from ad libitum-fed or 16 h fasted mice. Band density quantified from immunoblot (IB) shown in Fig. S1C. n = 5 mice per group. (D) Tbk1 expression in liver tissues from NCD or 8 weeks of HFD-fed mice. n = 4 mice per group. (E) IB analysis of TBK1 and pTBK1(Ser172) in livers from NCD or 8 weeks of HFD-fed mice. n = 5 mice per group. L.E., light exposure; D.E, dark exposure. (F) Quantified ratio of TBK1 and pTBK1(Ser172) in liver tissues from NCD or HFD-fed mice. n = 5 mice per group. (G) Tbk1 expression in primary hepatocytes treated with vehicle (DMSO) or TNFα for 24 h. n = 3 replicates per group. (H) Tnfa expression in primary hepatocytes treated with vehicle (DMSO) or TNFα for 24 h. n = 3 replicates per group. (I) IB analysis of pTBK1 (S172), TBK1, IκBα, pp65 (S536), and p65 in primary hepatocytes treated with vehicle or TNFα (50 ng/ml) for the indicated time. (J-N) 8 days of amlexanox treatment in diet-induced obese (DIO) mice. n = 5 mice for vehicle and 9 mice for amlexanox group. (J) Body weight after amlexanox treatment. (K) Blood glucose levels. (L) Epididymal adipose tissue (EAT) weight. (M) Liver weight. (N) Hepatic triglyceride (TG) levels (mg/g tissue). * p < 0.05, **p < 0.01, ***p < 0.001, N.S. no significance; p > 0.05. (Student’s t test for A, B, C, D, F, J, K, L, M, and N, One-way ANOVA for G and H). All data in the figure are shown as the mean ± SEM. See also Figure S1 and S2.

