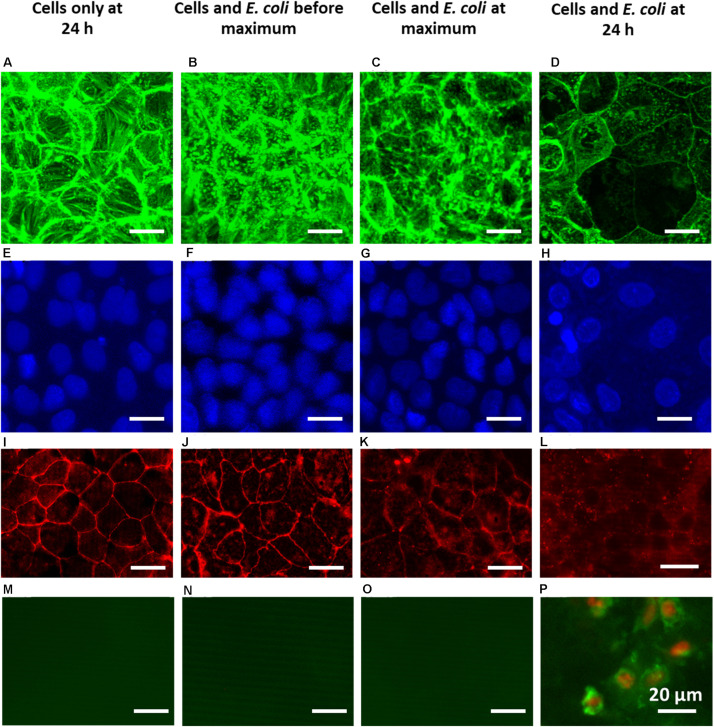
FIGURE 5.
Overlayer images of confocal stacks of Caco-2 BBe cell layers showing green-fluorescent cytoskeleton (A–D) and blue-fluorescent nuclei (E–H), fluorescence images of red-fluorescent ZO-1 tight-junction proteins (I–L) and apoptosis of green-fluorescent membrane-damaged cells with red-fluorescent nuclei (M–P). For comparison, a fluorescent image of apoptotic cells is shown in Supplementary Figure 3. (A,E,I,M) 24 h Caco-2 BBe cell layers grown in the absence of an E. coli challenge. (B,F,J,N) Caco-2 BBe cell layers in the presence of an E. coli (104 mL− 1) challenge before the occurrence of the TEER maximum, i.e., at 4 h. (C,G,K,O) Caco-2 BBe cell layers grown in the presence of an E. coli (104 mL− 1) challenge at the TEER maximum, i.e., at 8 h. (D,H,L,P) Caco-2 BBe cell layers grown in the presence of an E. coli (104 mL− 1) challenge after the occurrence of the TEER maximum, i.e., after 24 h.

