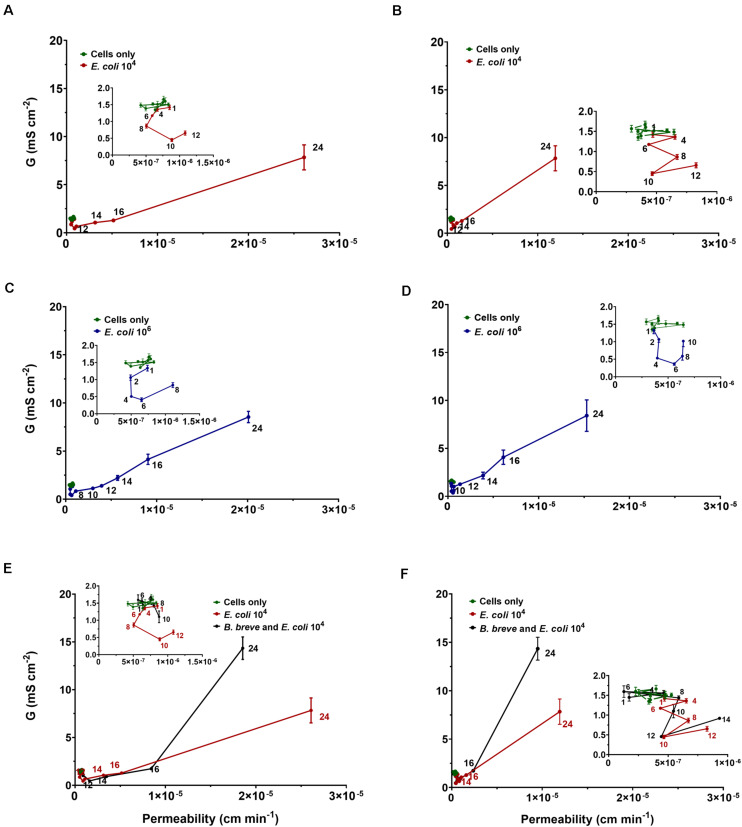
FIGURE 6.
The conductance G (reciprocal TEER) of Caco-2 BBe cell layers at different times after initiating an E. coli challenge in the absence and presence of B. breve ATCC 15700 (106 mL− 1) as a function of their permeability. The insets detail conductance as a function of permeability prior to the onset of linearity. (A) Conductance of epithelial cell layers as a function of permeability for 4 kDa FITC-labeled dextran at an E. coli challenge of (104 mL− 1). (B) Same as panel a, now for 10 kDa FITC-labeled dextran. (C) Conductance of epithelial cell layers as a function of permeability for 4 kDa FITC-labeled dextran at an E. coli challenge of (106 mL− 1). (D) Same as panel c, now for 10 kDa FITC-labeled dextran. (E) Conductance of epithelial cell layers as a function of permeability for 4 kDa FITC-labeled dextran at E. coli challenge (104 mL− 1) in absence and presence of B. breve (106 mL− 1). (F) Same as panel e, now for 10 kDa FITC-labeled dextran. Error bars represent standard errors of the mean over three experiments with separately grown cellular layers and bacteria.

