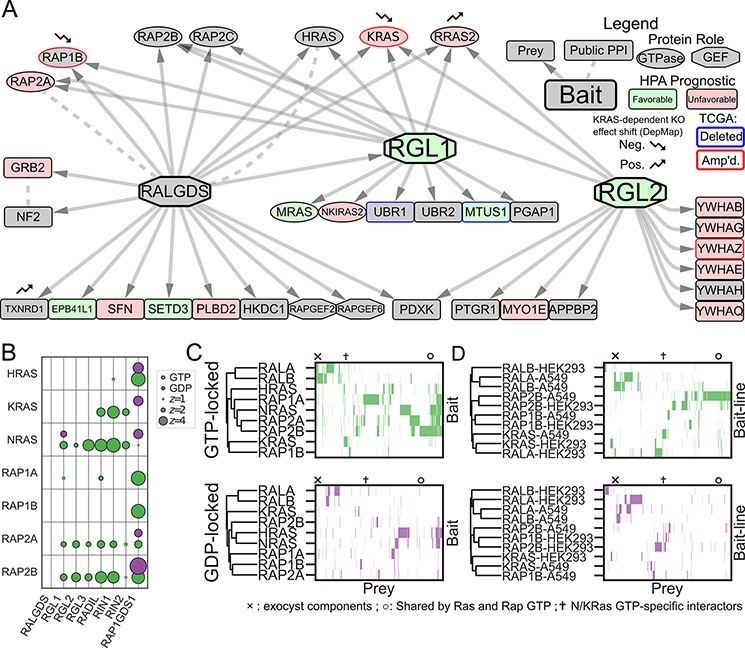
Figure 3. Systematic Mapping of the RAS/RAP/RAL Signaling Pathway Shows a Network of Interconnected GTPases.
A Network diagram of PPIs in A549 cells with RALGEF family members as baits. The RALGEFs differ in their PPIs, but collectively link numerous genes involved in signaling transduction and LUAD progression. Nodes are filled in green or red by their Human Protein Atlas (HPA) prognostic category, which is associated with the mRNA expression of the corresponding gene. Nodes are outlined in blue or red if their encoding genes are unusually up- or down-regulated by copy number alteration in LUAD (see Supplementary Methods). Nodes marked with small arrows show significant changes in knockout effect between KRAS-dependent and independent DepMap (11) cell lines. B Bubble plot of 14 AP/MS experiments with GTP- and GDP-locked mutant GTPases as baits (rows), showing the enrichment of selected preys (columns). RAP2A and RAP2B bind some canonical RAS effectors in their GTP-locked states. C Clustermap of prey proteins significantly enriched (FDR<0.05; see Methods) in each experiment with the indicated baits in A549 cells. Prey protein order is preserved across panels C and D, but prey proteins not significantly enriched in at least one experiment were removed for simplicity. Symbols indicate columns in the clustermap corresponding to proteins of interest: × Exocyst components; ✝N/KRAS-GTP specific interactors; ○ Common interactors of K- and NRAS and of RAP2. D Clustermaps as in C but comparing GTPases that were used as bait proteins for AP/MS experiments in both A549 and HEK293 cells.

