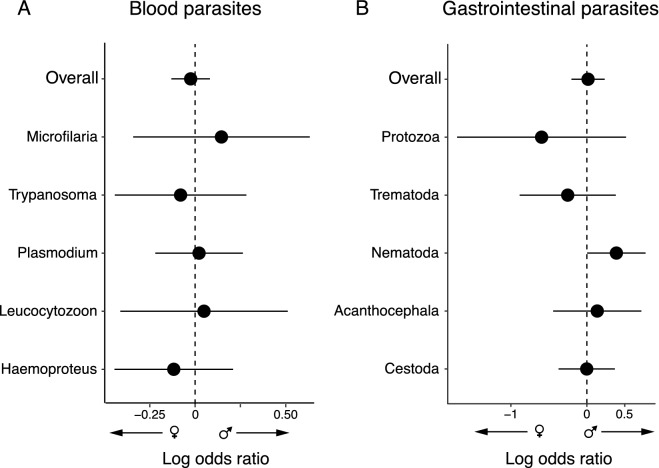
Figure 1.
Sex bias in prevalence of (A) blood parasites and (B) gastrointestinal parasites in birds. Weighted average effect size estimates, showing lower and upper 95% confidence intervals in overall meta-analyses and broken down results according to parasite category (see Material and methods). The dashed vertical line indicates no sex difference, positive values represent male bias prevalence and negative values female bias. See Table 1 for statistics.

