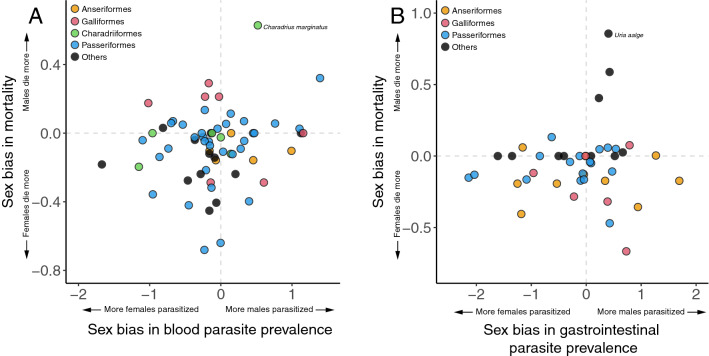
Figure 2.
Sex bias in annual mortality in relation to the sex bias in prevalence of (A) blood and (B) gastrointestinal parasites (see Table 2 for statistics). Sex bias in mortality was expressed as log(male mortality/female mortality), whereas the sex bias in parasite prevalence was expressed as the weighted average effect size of all comparisons (see Material and methods). Represented in colors are the avian orders with the greatest numbers of species in each of the analyses (full species list in supplementary material). Outliers are specified. Dashed lines indicate no sex difference, positive values represent male bias and negative values female bias.

